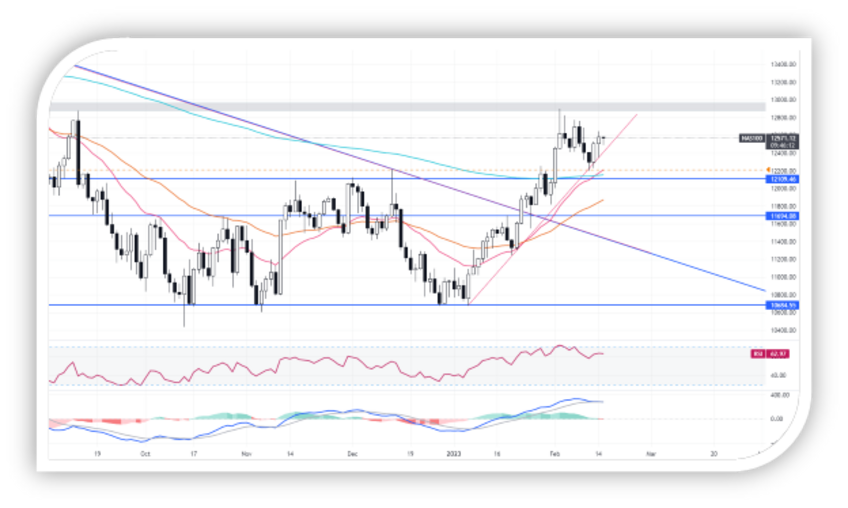
Daily Analysis NAS100 - 15 Feb 2023
Latest News: On Wednesday, Nasdaq100 futures indicated that the market would start with a decrease, as investors evaluate the future of interest rates. This was in response to recent consumer price data which showed an increase in inflation during the previous month.
Technical Analysis: The Nasdaq is showing signs of a bullish recovery after finding support along the upward trendline. The key resistance level to watch for is 12.630, while the support level can be found at 12.200. Traders should monitor the price action for a potential breakout above the resistance level, which could signal further bullish momentum. Conversely, a break below the support level could indicate a bearish trend reversal.
Support: 12.200 – 11.900 – 11.600 Resistance: 12.630 – 12.750 – 12.900

