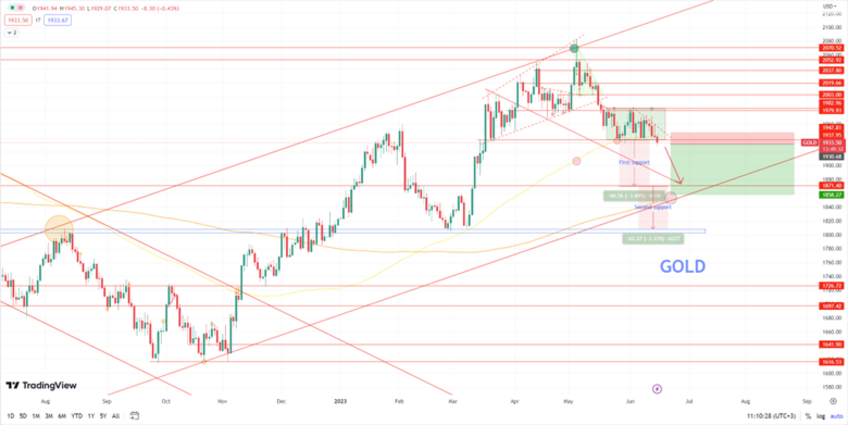
Daily Analysis XAUUSD - 15 June 2023
The Federal Reserve held its monetary policy meeting on Wednesday and maintained the Fed funds rate at 5.0%-5.25%, signaling a pause to its interest-rate hiking cycle for the first time since early 2022. However, the Fed's Dot Plot chart showed a hawkish outlook, with the terminal rate projection for end-2023 revised upwards to 5.6% from 5.1% in March. This led to the US Dollar and US Treasury bond yields rebounding. Chairman Jerome Powell stated that the Fed will continue to watch how the labor market moves and that the July meeting will be a "live" one, with odds for a 25 bps rate hike next month increasing to around 70%. The gold price reversed its early bounce and settled near daily lows, with markets closely scrutinizing incoming US economic data to reprice Fed expectations. The European Central Bank is expected to raise key rates by 25 bps, with markets predicting a pause in September.
The gold price is currently showing signs of a potential bearish breakout below the 100-day moving average (100MA) on the daily chart, which has acted as a significant level of support in the past. If the ongoing selling pressure persists and confirms the breakout, the next key support levels to watch are around 1900, followed by a stronger support area in the range of 1870-1860. These levels could serve as the final target for the downward movement.
|
Resistance 3 |
Resistance 2 |
Resistance 1 |
Support 1 |
Support 2 |
Support 3 |
|
2000 |
1980 |
1950 |
1937 |
1870 |
1800 |

