US Stock Futures Stall Amid Fed Rate Cut Speculation and Nasdaq Resistance
US stock index futures showed little movement on Wednesday following a period of robust gains that propelled the benchmark S&P 500 to over three-week highs. Investors are seeking further clarity regarding the Federal Reserve's intentions regarding interest rate cuts. May has seen mostly upward movement in markets, with investors finding reassurance in a positive earnings season and a recent labor market report that was softer than expected. This report eased concerns about the Fed maintaining higher interest rates for an extended period. During the day, investors will closely monitor remarks from Fed Vice Chair Philip Jefferson, Boston Fed President Susan Collins, and Governor Lisa Cook for fresh insights into the central bank's monetary policy plans. As the earnings season winds down and only a few economic reports are anticipated this week, attention is turning to next week's consumer prices reading to assess inflation trends. Traders are currently pricing in a 49% likelihood of a 25 basis point interest rate cut by the US central bank in September, according to the CME Group's Fedwatch tool. This is up from 43% a week earlier. Additionally, there is a 36% probability of another rate cut in December.
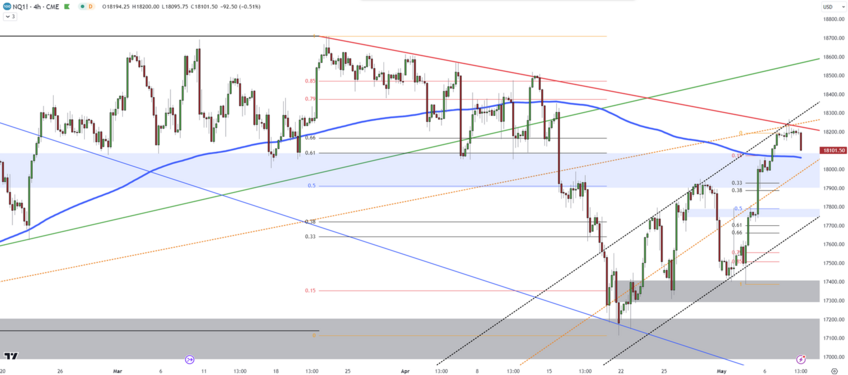
The possibility of a correction movement emerged in the Nasdaq as the specified level of 18,250 acted as resistance yesterday, resulting in selling pressure from this area. In this context, if the downward movement continues, the range of 18,060-18,020 will emerge as the first support level. The breakdown of this level, which serves as both horizontal support and the moving average, could extend the pullback to the range of 17,920-17,900. Failure to hold above this area could lead to declines extending to the range of 17,800-17,785. However, if the correction movement has not started and the price reverses upwards again, the first resistance will once again be at 18,250. As this area serves as both horizontal resistance and descending trend resistance, breaking through it could bring momentum to the price, with the next level to watch being 18,480-18,500. Above this level, the former peak resistance at 18,700 will be monitored.
|
Resistance 3 |
Resistance 2 |
Resistance 1 |
Support 1 |
Support 2 |
Support 3 |
|
18,700 |
18,500 |
18,250 |
18,020 |
17,900 |
17,785 |

