

Understanding DSGE Model Implications: Insights from NY Fed’s Latest Forecasts
The New York Federal Reserve recently released its latest forecasts using an advanced tool known as the DSGE model. The DSGE model acts as a benchmark for economists, helping them predict the real natural rate of interest. This rate essentially acts as a sort of optimal level for the economy to keep things running smoothly, with full employment and stable prices.
According to the projections, the average real natural rate is expected to hover around 2.1% in 2024. Here's a visual representation of the implied core PCE (red line) and the average of the SOFR (blue line) from the model through the beginning of January 2027.
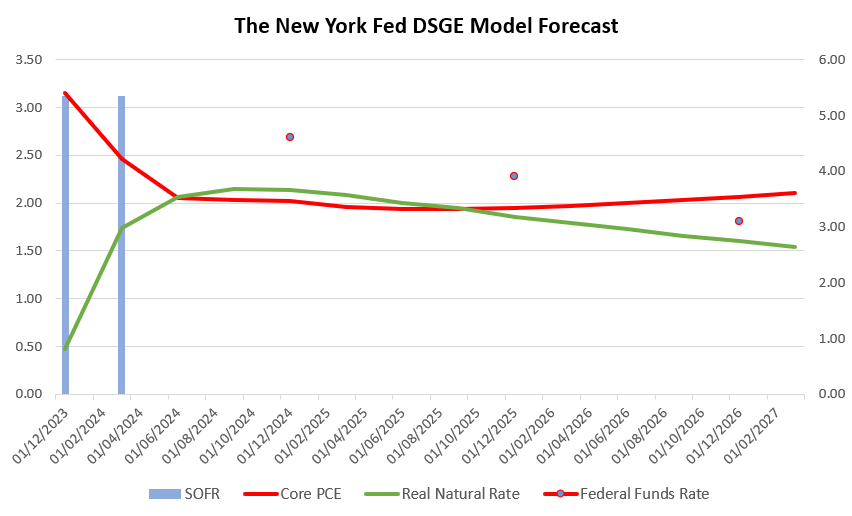
Now, the projection of the Fed funds rate is represented by the red dots on the graph. It appears to be around 4.60% in 2024. The real natural rate is 2.14%. Thus, it appears that Fed policy will continue to be restrictive based on this interpretation. In other words, if we consider the new dot plot, which includes upward shifts to the years 2025 and 2026, and long-term median markers, policy will only be restrictive relative to the model's implied equilibrium rate for this year.