


The Supertrend indicator is a tool commonly used in technical analysis, particularly for identifying trend direction and determining entry and exit points for trades. Based on price movements, it helps traders understand whether the current market trend is upward or downward.
The indicator is visualized on a price chart with lines drawn above or below the price. These lines indicate the direction of the trend and change color according to price movements. If the line is below the price, it represents an uptrend, while if it is above the price, it signifies a downtrend.
The indicator helps identify whether the market trend is upward or downward and provides clear signals for trend reversals.
To generate buy and sell signals using the Supertrend indicator, follow these steps:
The Supertrend Indicator uses price movement and volatility to identify trends. A key component is the Average True Range (ATR), which measures market volatility over a set number of periods (e.g., 10 or 14).
Key Steps:
Supertrend Bands:
Trend Direction:
Adjustments:
The Supertrend indicator is used to analyze market trends and support buy-sell decisions. Simply put, if the indicator line is below the price, it signals an uptrend, and buying opportunities should be considered. Conversely, if the indicator line is above the price, it indicates a downtrend, suggesting selling opportunities.
You can see more detailed guidance in the table below:
| Condition | Supertrend Position | Market Interpretation | Trading Decision |
| Price is above the Supertrend | Below the price | Uptrend | Consider buy positions |
| Price is below the Supertrend | Above the price | Downtrend | Consider sell positions |
| Price touches the Supertrend | Changes position | Potential trend reversal | Observe the new trend direction |
| Supertrend moves sideways | Does not cross price | Consolidation (no clear trend) | Avoid trading or use tight stop-loss |
| High volatility | Frequently changes position | Choppy market conditions | Use longer period settings |
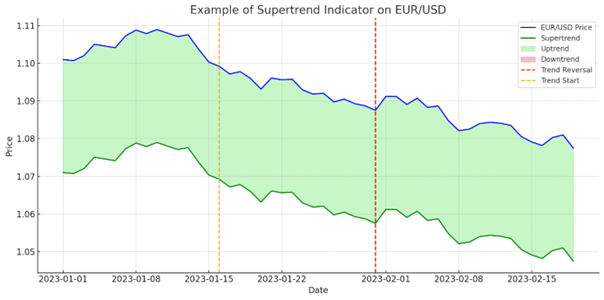
The above chart provides an example of the Supertrend indicator applied to the EUR/USD currency pair.
The chart can be interpreted as follows:
The first buy signal occurs when the price breaks above the Supertrend line at the 1.0950 level. This indicates the start of an upward move in the market and suggests a favorable period for entering long positions. From this level, the price steadily rises, reaching as high as 1.1100.
During this uptrend, as long as the price remains above the Supertrend line, the market displays strong upward momentum. Particularly, when the price surpasses the 1.1050 level, it confirms that the trend is continuing strongly, with buyers dominating the market.
Subsequently, the price reaches a peak around 1.1100 and begins to pull back, eventually falling below the line at the 1.1000 level. This breach signals the start of a downtrend and indicates a shift in market direction. At this point, sellers take control, and the price declines to as low as 1.0850.
The Supertrend indicator demonstrates how price movements behave during both uptrends and downtrends. The points where the price breaks the indicator line and remains either above or below it provides actionable entry and exit signals for traders.
First of all, it is suitable for both short-term and long-term trading strategies.
The Supertrend indicator not only assists investors in understanding market trends but also serves as a tool for setting stop-loss levels. This simplifies risk management and enhances discipline during trading.
Some strategies where the Supertrend indicator can be used are as follows:
Is the Supertrend Indicator Reliable?
The Supertrend indicator is a highly effective tool for determining trend direction and analyzing market fluctuations. However, no technical indicator is completely flawless. It can produce false signals, especially in ranging markets or during periods of low volatility. Therefore, combining it with other indicators can enhance its reliability.
How Can You Avoid False Signals With the Supertrend Indicator?
To avoid false signals in the Supertrend indicator, it’s important to account for volatility and analyze over longer time frames. Optimizing the ATR (Average True Range) settings can help adjust the indicator’s sensitivity to match market conditions. Additionally, using it alongside other indicators for confirmation can further reduce errors.
What Is the Best Technical Indicator To Use With the Supertrend Indicator?
The Supertrend indicator works well when paired with other indicators like RSI, MACD, or moving averages. For example, RSI can identify overbought or oversold zones, complementing the signals from Supertrend. MACD, on the other hand, can analyze the strength and momentum of the trend.
How Is Supertrend Different From SMA?
The Supertrend indicator is used to determine trend direction and generate buy/sell signals, while the Simple Moving Average shows the average price over a set period. Supertrend takes volatility into account to detect trend reversals, whereas SMA offers only a general price trend. Moreover, Supertrend is faster and visually more distinct in signaling changes.
Can Supertrend Be Used for Scalping?
Yes, the Supertrend indicator can be used for scalping strategies. It provides quick entry and exit opportunities when the price breaks above or below the Supertrend line on shorter timeframes. However, it’s more prone to false signals in scalping scenarios, so it’s recommended to combine it with additional indicators like Bollinger Bands or Stochastic Oscillator for better accuracy.
Regístrese gratis en segundos, acceda a su plataforma y empiece a operar con facilidad.
 Puntos pivote: definición, estrategia y uso práctico
Los puntos pivote son una herramienta de análisis técnico que se utiliza para identificar niveles de precios clave en los que el mercado podría cambiar de dirección.
Detalle?") ¿Qué son los gastos de consumo personal (GCP)?
¿Qué son los gastos de consumo personal (GCP)?
Los gastos de consumo personal miden el gasto total de los consumidores en bienes y servicios en una economía. En nuestro artículo, compartimos información detallada sobre el PCE.
Detalle") Definición y estrategia del ADX (índice direccional medio)
Definición y estrategia del ADX (índice direccional medio)
El índice direccional promedio es un indicador de análisis técnico que se utiliza para medir la fuerza de una tendencia. En este artículo, exploraremos qué es el indicador ADX.
DetalleÚnase a nuestro canal de Telegram y suscríbase gratis a nuestro boletín de señales de trading.
Únete a nosotros en Telegram


