


What does “risk-on” look like in the data? You don’t need a crystal ball. A few index-based ratios can show when investors favor growth over safety, or the other way around.
You can read these shifts with a few simple index and sector ratios. No complex models. Just clear signals you can check daily.
Workflow tip: Use at least two lenses together. If signals disagree, reduce size or wait.
Markets often move in two broad moods: risk-on and risk-off.
Risk-on: Investors are willing to take risk. Money flows into equities, high-yield bonds, and growth-sensitive assets. Small caps and cyclical sectors usually lead.
Risk-off: Investors shift to safety. Defensive stocks, government bonds, the U.S. dollar, and gold tend to outperform. Volatility often rises as traders cut risk.
These indices are drawn from stock market sectors. They help reveal if investors are putting money into growth names or shifting toward defensives.
This ratio compares two sector ETFs. XLY tracks companies that benefit when people spend more freely (Amazon, Nike, Tesla). XLP tracks companies that sell essentials (Procter & Gamble, Coca-Cola).
If XLY outperforms XLP, investors are taking more risk → risk-on.
If XLP leads, money is flowing to safety → risk-off.
In early 2021, stimulus checks lifted spending. XLY surged versus XLP, showing clear risk-on behavior.
IWM tracks the Russell 2000 (small U.S. companies). SPY tracks the S&P 500 (large U.S. companies).
Small caps do better when investors are confident in growth → risk-on. When small caps lag, it signals caution → risk-off.
In 2022, rising rates hit small caps harder. IWM fell against SPY, a clear risk-off sign.
SPY is weighted by market cap, so giants like Apple and Microsoft dominate. RSP gives every stock the same weight.
If RSP keeps pace with or beats SPY, it shows broad participation → healthy risk-on. If only the big names drive gains, it’s weaker → risk-off tone.
In 2023, SPY rose on mega-cap tech, while RSP lagged. That told traders the rally was narrow and fragile.
High-beta stocks move more than the market. Low-volatility stocks move less. Indices exist for both groups.
When high-beta stocks lead, investors are comfortable with risk → risk-on. When low-volatility stocks lead, traders are defensive → risk-off.
In late 2018, market stress sent money into low-volatility stocks, flipping the signal to risk-off.
These signals come from outside equities. They add another layer by showing how credit, commodities, and volatility behave when risk sentiment shifts.
HYG tracks high-yield (“junk”) bonds. IEF tracks U.S. Treasuries with 7–10 year maturities.
When HYG outperforms IEF, investors are taking credit risk → risk-on. When Treasuries lead, money is hiding in safety → risk-off.
In March 2020, HYG collapsed while IEF rallied, flashing an extreme risk-off signal.
Copper is tied to growth and construction. Gold is tied to safety and value storage.
When copper rises relative to gold, it points to confidence in growth → risk-on. When gold outperforms, fear is higher → risk-off.
In 2021, copper surged while gold lagged, confirming a strong global risk-on tone.
VIX tracks expected volatility in the S&P 500. MOVE tracks expected volatility in U.S. Treasuries.
When volatility spikes, it shows fear → risk-off. When volatility is calm, it supports risk-on.
In late 2022, the VIX stayed above 30 for weeks, reflecting a risk-off environment.
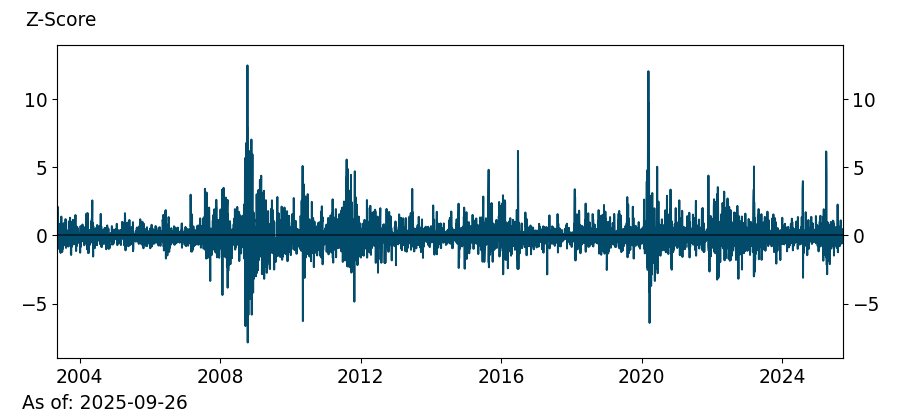
The Kansas City Federal Reserve created the Risk-On/Risk-Off (RORO) Index to track global market sentiment in a single number. It combines signals from different markets: credit spreads, equity volatility, funding conditions, and FX/gold moves.
What it says:
Key features:
Below you can see the RORO Index plunged during the COVID shock, confirming an extreme risk-off regime. It then recovered as central bank support and fiscal stimulus pushed markets back into risk-on mode.
|
Point in Time |
RORO Value |
Note |
|---|---|---|
| Start of Jan 2020 | 0.07 | Neutral sentiment at the beginning of the year. |
| April 8, 2020 (low) | -2.86 | Sharpest risk-off reading during the COVID crash. |
| End of Dec 2020 | -0.79 | Partial recovery with sentiment still below neutral. |
The data shows a plunge of nearly 3 points from early 2020 to the April crash, with only a modest rebound by year-end.
Source: KC Fed
Instrument: S&P 500 (Index CFD)
Selected ratio: XLY / XLP (Consumer Discretionary vs Staples)
It tells: Investors are shifting into risk-on mode when discretionary stocks lead staples.
The story:
The XLY/XLP ratio started trending higher in early June, showing stronger demand for growth-oriented stocks like Amazon and Tesla over defensive names like Coca-Cola and Procter & Gamble. At the same time, the HYG/IEF ratio also ticked higher, confirming risk-on sentiment in credit markets.
Seeing both signals align, the trader opened a long position on the S&P 500 CFD. The expectation was that equity markets would continue to climb as money flowed into cyclical sectors.
Balance: $10,000
Lot size: 0.5
Leverage: 1:200
Price movement: From 5,250 to 5,330
Position closed at: 5,330
Result: +$400 profit
Lesson:
When two different ratios confirm the same market tone, the signal is stronger. The trade worked because sentiment aligned across both equities and credit. It shows the value of combining multiple indicators rather than relying on just one.
These sentiment tools are helpful, but they’re not perfect. Markets change, and the signals can behave differently across cycles.
Takeaway: Treat these ratios as guides, not rules. They work best when combined with context and other analysis.
|
Scenario |
Ratio / Index Behavior |
Market Tone |
Example Interpretation |
|---|---|---|---|
| Consumers spend more | XLY/XLP rising | Risk-On | Growth names like Amazon lead over defensives like Coca-Cola. |
| Small caps lead | IWM/SPY rising | Risk-On | Confidence in local growth, investors move into smaller companies. |
| Broad rally | RSP/SPY rising | Risk-On | Wider participation, not just mega-cap tech holding the market. |
| High-yield bonds strong | HYG/IEF rising | Risk-On | Credit spreads tighten, risk appetite improves. |
| Copper beats gold | Copper/Gold rising | Risk-On | Growth outlook firming, demand for industrial metals |
| Defensives lead | XLY/XLP falling | Risk-Off | Investors rotate into staples for safety |
| Small caps lag | IWM/SPY falling | Risk-Off | Traders cautious, money flows into large caps |
| Treasuries lead | HYG/IEF falling | Risk-Off | Flight to safety in government bonds |
| Gold outperforms copper | Copper/Gold falling | Risk-Off | Growth fears rising, capital moves into safe havens |
| Volatility spikes | VIX or MOVE rising | Risk-Off | Fear dominates, traders cut risk exposure |
Can I see risk-on or risk-off from price alone?
Not always. A rising index doesn’t tell you if it’s broad risk-on or just a few big stocks leading. Ratios help reveal the difference.
Do I need special tools to track these ratios?
No. Most are simple ETF or index pairs (like XLY/XLP or HYG/IEF) you can chart on free platforms.
Does risk-on sentiment always mean a bullish market?
No. Sometimes currencies, commodities, or bonds react differently even when equities are in risk-on mode.
How often should I check these ratios?
Daily is fine for swing trading. Intraday checks make sense only around big events like Fed meetings or CPI releases.
Can these signals be used for stop-loss adjustments?
Yes. If sentiment ratios flip against your trade, it’s a warning sign to tighten stops or cut exposure.
Which ratio is most stable in volatile markets?
Credit vs Treasuries (HYG/IEF) usually holds up better than equity-only ratios during shocks.
How do central bank policies distort these signals?
Large liquidity injections can lift both risky and safe assets at the same time. This makes the ratios less reliable.
Do these ratios work outside the U.S.?
Yes, but you need local equivalents. For example, Europe has discretionary vs staples sector ETFs under UCITS rules.
What’s the best way to backtest sentiment ratios?
Use rolling correlations with index returns. That shows when the ratio was a reliable guide and when it broke down.
Can machine learning improve risk-on/risk-off models?
Yes. Some funds use ML to combine multiple ratios and macro data. The key is weighting signals dynamically, since no single ratio works forever.
Sign up in seconds for free, access your platform, and start trading with ease.
 $200 Oil Scenario: The Chain Reaction Across Markets
What happens if oil hits $200? See the impact on global markets, sectors, inflation, and which industries could win or lose.
Detail Biggest Manipulations in Financial Market History
Financial markets have seen their share of manipulation over the years. Here are seven of the biggest cases in modern history.
Detail Petrodollar System: Why It Still Matters
Energy markets depend on supply routes, currency systems, and trade infrastructure determine prices, inflation, and financial stability across the global economy.
DetailThen Join Our Telegram Channel and Subscribe Our Trading Signals Newsletter for Free!
Join Us On Telegram!


