


Chart patterns help investors understand price movements better and predict future price directions. One such pattern, known as the pennant pattern, is particularly recognized as a continuation pattern.
Pennant formations typically represent a brief consolidation period following a strong price movement. They allow investors to evaluate market trends and potential price breakouts.
Read our article to learn more about pennant patterns in detail.
A pennant pattern is a technical analysis formation that shows a short consolidation period following a strong price movement. The pattern, where prices narrow within a range to form a small rectangle, typically indicates a continuation of the trend.
The pennant formation begins with a swift and steep price movement, known as the flagpole. This movement demonstrates a strong market bias in a particular direction, followed by a period where prices compress into a narrower range, forming a triangular shape. During this period, volume usually decreases.
When the formation completes, prices typically break out strongly in the direction of the flagpole. This breakout is often accompanied by high volume, indicating a continuation of the trend.
To identify a pennant chart pattern, follow these key steps:
The pennant pattern is recognized in technical analysis as a continuation pattern. It usually forms after a strong price move, indicating that the existing trend is likely to continue.
First, the market gains momentum in a certain direction with a strong price movement. Following this price change, known as the flagpole, prices consolidate within a narrowing range. During this period, price movements slow down, and a consolidation phase occurs in the market.
The narrowing rectangle formation indicates that the market is approaching a decision point and that a strong movement in a certain direction is imminent. Subsequently, a high-volume breakout occurs, indicating the continuation of the trend.
Pennant formations are divided into two main categories based on the direction of the price movement:
A bullish pennant appears during an uptrend and indicates the continuation of the trend. Let's examine a bullish pennant example in the chart below:
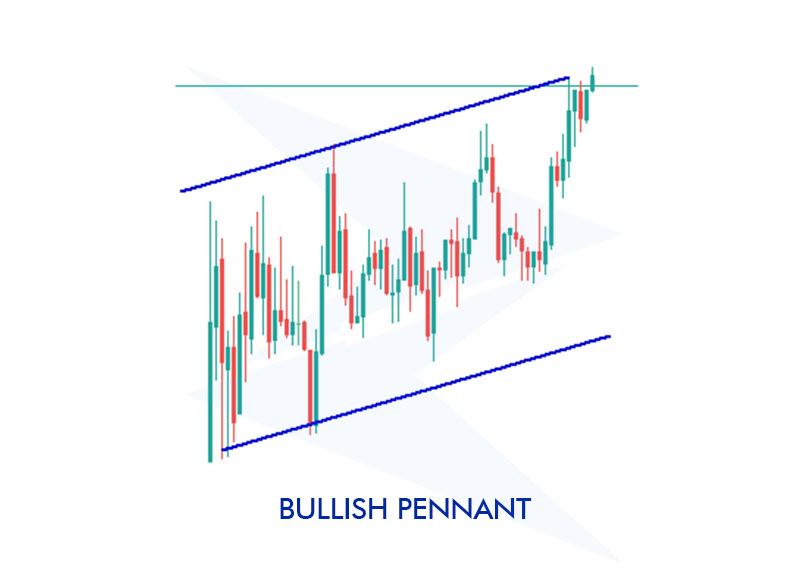
Let's consider the EUR/USD pair in the forex market. If the pair shows a rapid rise from the 1.1000 level to the 1.1200 level. After the rise, prices consolidate in a narrowing range between 1.1150 and 1.1200. If prices break upward after the consolidation, we can consider the bullish pennant formation confirmed.
A bearish pennant starts with a sharp decline and is interpreted as a continuation of the downtrend after consolidation. You can see an example in the chart below:
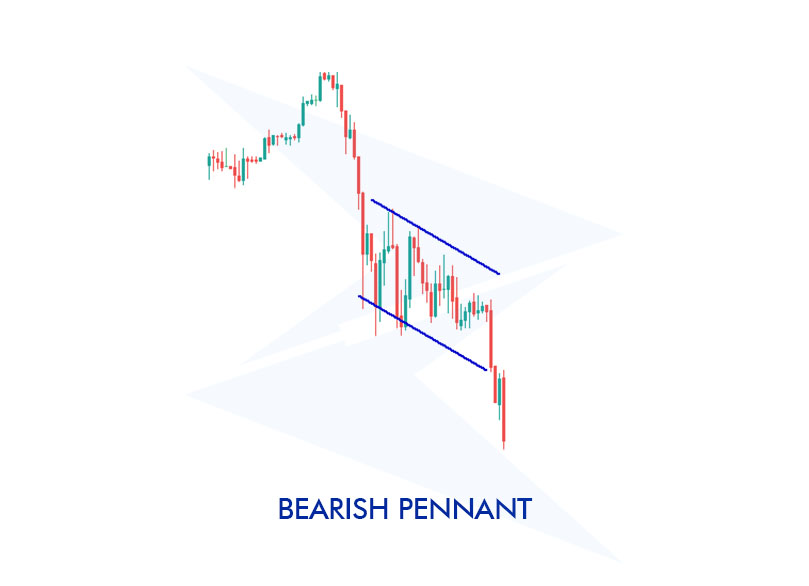
Let's consider gold prices dropping rapidly from $1500 to $1450. Following the drop, prices consolidate within a narrowing range between $1450 and $1460, forming a small rectangle. At this point, traders might expect a downward breakout.
What indicator is best to trade with a pennant pattern?
The best indicator to use when trading a pennant pattern is the volume indicator. Volume is one of the key indicators for confirming the strength and validity of the breakout. Breakouts that occur with high volume are generally more reliable and provide stronger signals for the continuation of the trend.
Is it possible to trade a pennant pattern with Fibonacci Retracement?
Yes, it is possible to trade a pennant pattern using Fibonacci Retracement. By observing how price movements react to specific Fibonacci levels, you can better identify support and resistance levels. This type of analysis allows you to see potential entry and exit points more clearly.
Can a pennant pattern be traded with Moving Averages?
Yes, a pennant pattern can be traded with Moving Averages (MA). Moving averages help determine the direction and strength of the trend. Specifically, the price movement above or below the MA can provide clues on whether the trend will continue.
When is the best time to trade a pennant pattern?
The best time to trade a pennant pattern is when the pattern is completed, and the price makes a strong breakout from the support or resistance level.
What are the common mistakes traders make when trading a pennant pattern?
Common mistakes traders make when trading a pennant pattern include mistaking false breakouts for genuine ones, considering breakouts with low volume, and not supporting the pattern with other technical analysis tools. Another common mistake is making emotional decisions and acting too quickly before the pattern is fully formed.
Sign up in seconds for free, access your platform, and start trading with ease.
 $200 Oil Scenario: The Chain Reaction Across Markets
What happens if oil hits $200? See the impact on global markets, sectors, inflation, and which industries could win or lose.
Detail Biggest Manipulations in Financial Market History
Financial markets have seen their share of manipulation over the years. Here are seven of the biggest cases in modern history.
Detail Petrodollar System: Why It Still Matters
Energy markets depend on supply routes, currency systems, and trade infrastructure determine prices, inflation, and financial stability across the global economy.
DetailThen Join Our Telegram Channel and Subscribe Our Trading Signals Newsletter for Free!
Join Us On Telegram!


