


Pivot points are practical tools traders use to identify potential market turning points. These tools help predict support and resistance levels for the current session by analyzing price levels from the previous trading session.
Pivot points are a technical analysis tool used to identify key price levels where the market might change direction. They are calculated based on the previous trading session's high, low, and closing prices and act as a reference for traders to predict support and resistance levels. This makes them particularly useful for planning trades in both volatile and steady markets.
Pivot points are helpful in determining whether the market is trending bullish or bearish. They serve as a guide for traders to observe the potential price reversals or breakouts during the trading session.
If the price moves above the pivot point, it indicates a bullish trend, suggesting that buyers are in control. This often leads the price toward resistance levels (R1, R2), where traders might set profit targets or evaluate further momentum.
On the other hand, if the price falls below the pivot point, it signals a bearish trend, meaning sellers are in control. In such cases, the price typically moves toward support levels (S1, S2), where traders may look to take profits or prepare for potential reversals.
Pivot points provide a straightforward way to gauge market sentiment and plan trades based on the price's relationship to these critical levels.
Pivot points are calculated using formulas that provide a framework for identifying support and resistance levels in trading. Below, we’ll explore the most common calculation method called the 5-point system, as well as alternative approaches like Tom DeMark’s method and weekly or monthly pivot points for longer-term strategies.
The 5-point system is the most famous method for calculating pivot points. It uses the previous trading session’s high, low, and close prices to calculate the pivot point and its associated support and resistance levels.
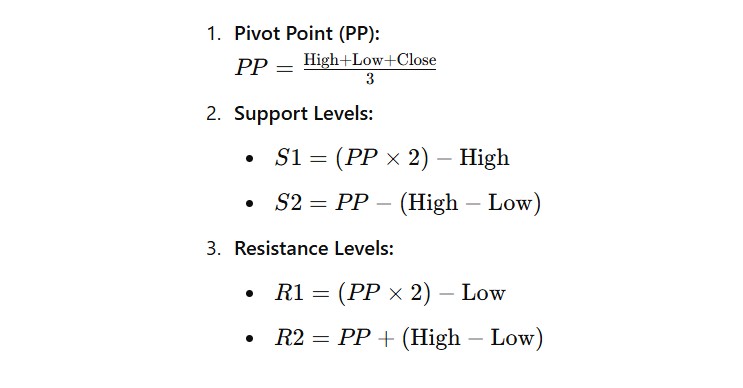
These levels highlight potential resistance zones at R1 and R2, as well as support areas at S1 and S2.
Tom DeMark developed an alternative approach that adjusts the pivot point calculation based on the relationship between the opening and closing prices of the previous session. This method is particularly useful for traders looking for more dynamic pivot points.
| Condition | Formula for Pivot Point |
| If Open > Close | P = ((high x 2) + Low + Close)) / 4 |
| If Open < Close | P= ((Low x 2) + High + Close)) / 4 |
| If Open = Close | P= ((High + Low + (Close x 2)) / 4 |
The resulting P value is then used to calculate today's support and resistance levels, similar to the standard method:
While the standard 5-point system is based on daily data, weekly and monthly pivot points are favored by swing traders or position traders focusing on longer-term trends.
Pivot point analysis provides traders with valuable insights into key price levels, helping them observe market trends and refine their entry or exit strategies. Let’s take a closer look at how pivot points can be effectively used in both intraday and swing trading.
Day traders rely on pivot points to analyze market sentiment and identify actionable S/R levels during a single trading session.
They often look for price reversals near these levels. If the price approaches a support level (S1) and bounces upward, it’s seen as a buying opportunity. On the other hand, if the price tests a resistance level (R1) and reverses downward, it signals a selling opportunity.
When the price breaks above or below resistance or support levels, it indicates strong momentum in that direction and is referred to as a breakout. If the price breaks above R1, it’s a bullish signal, suggesting the price may head toward R2. If the price falls below S1, it’s a bearish signal, pointing toward S2 as the next target.
Swing traders use the high, low, and close prices from the previous week to determine pivot points and their corresponding S/R levels.
Weekly pivot points act as a reference for price movements over the following week. They are particularly useful for identifying reversal zones and breakout points in trending markets.
Analysts can also use pivots to predict longer-term support and resistance levels. If the price approaches weekly R1 and reverses downward, swing traders may consider entering a short position. Similarly, if the price bounces off weekly S1, it could signal a buying opportunity.
Even though pivot points are powerful tools themselves, their effectiveness can be strengthened by combining them with other technical indicators.
Using them with tools like Fibonacci retracement, moving averages, and candlestick patterns can provide a more comprehensive view of the market.
Pivot points provide key levels of support and resistance, while Fibonacci retracement highlights potential reversal zones within a trend. If a pivot point aligns closely with a Fibonacci level, it strengthens the case for a potential reversal or breakout.
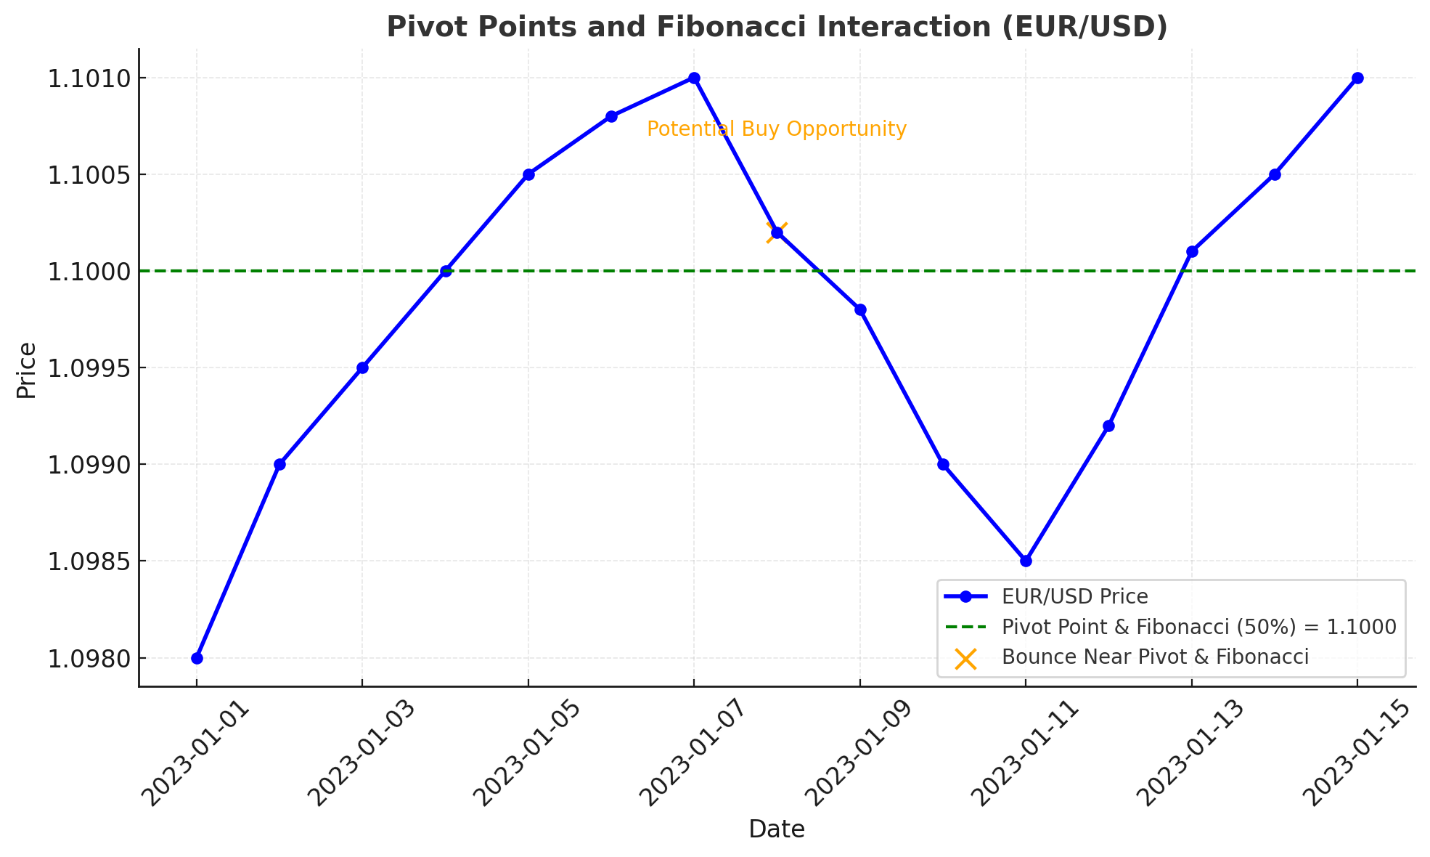
Let’s say EUR/USD is approaching a pivot point at 1.1000, which also coincides with a 50% Fibonacci retracement level from the previous trend. Traders might expect strong support here and look for a buying opportunity.
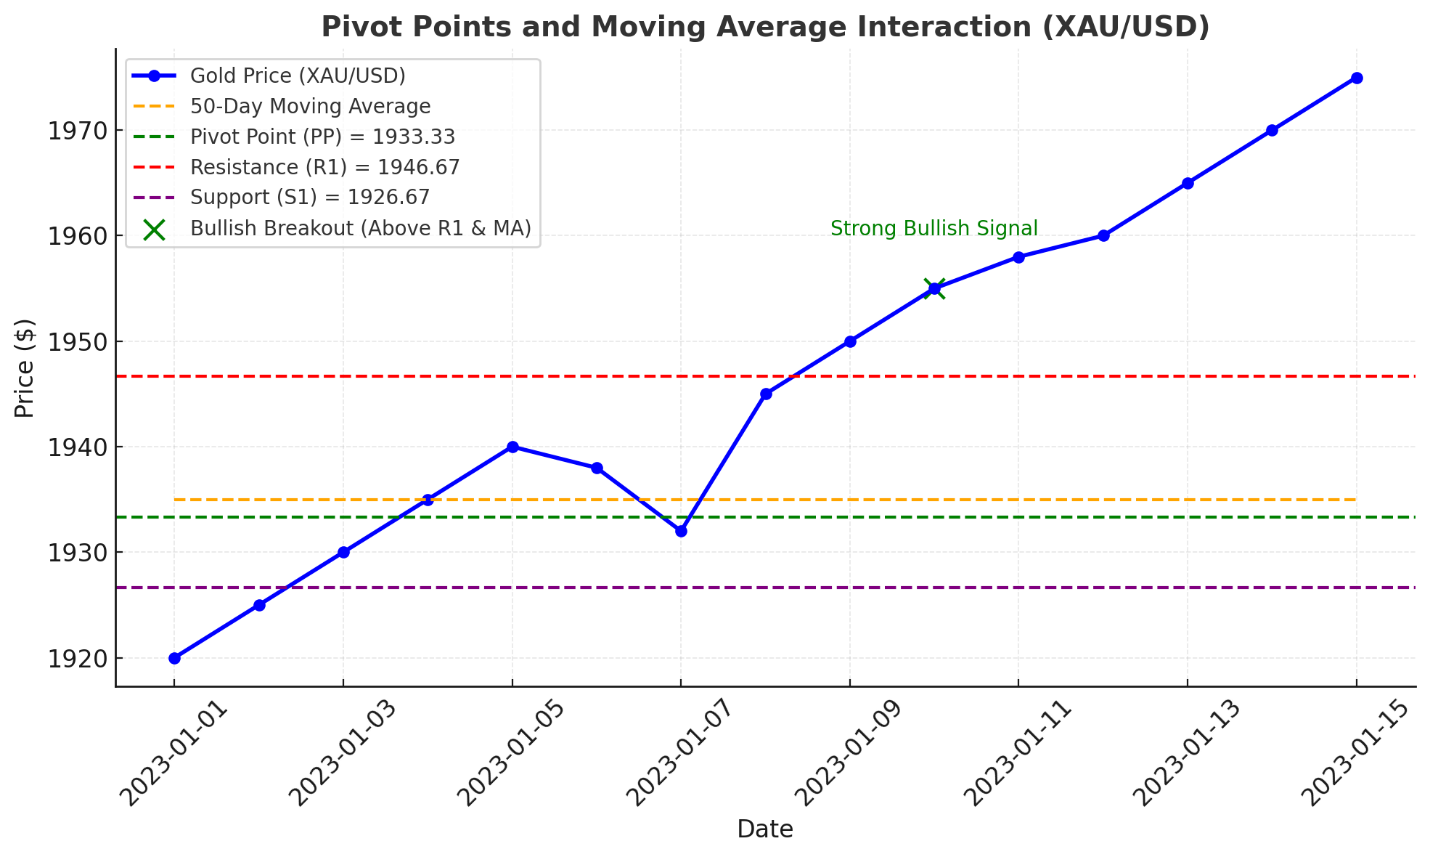
If the price is trading above the moving average and breaks above the pivot point, it signals bullish momentum. Conversely, if the price is below the moving average and breaks below the pivot point, it suggests bearish momentum.
Imagine a trader analyzing gold (XAU/USD) notices the price holding above the 50-day moving average while breaking R1. This indicates strong bullish momentum and validates a potential long position.
Candlestick patterns, such as doji, engulfing patterns, or hammer formations, provide insights into price action and market sentiment. When these patterns form near pivot points, they act as confirmation for potential reversals or breakouts.
A bullish hammer forming near S1 could indicate a strong reversal upward; or a bearish engulfing pattern near R1 might confirm a rejection of resistance and a potential downward move.
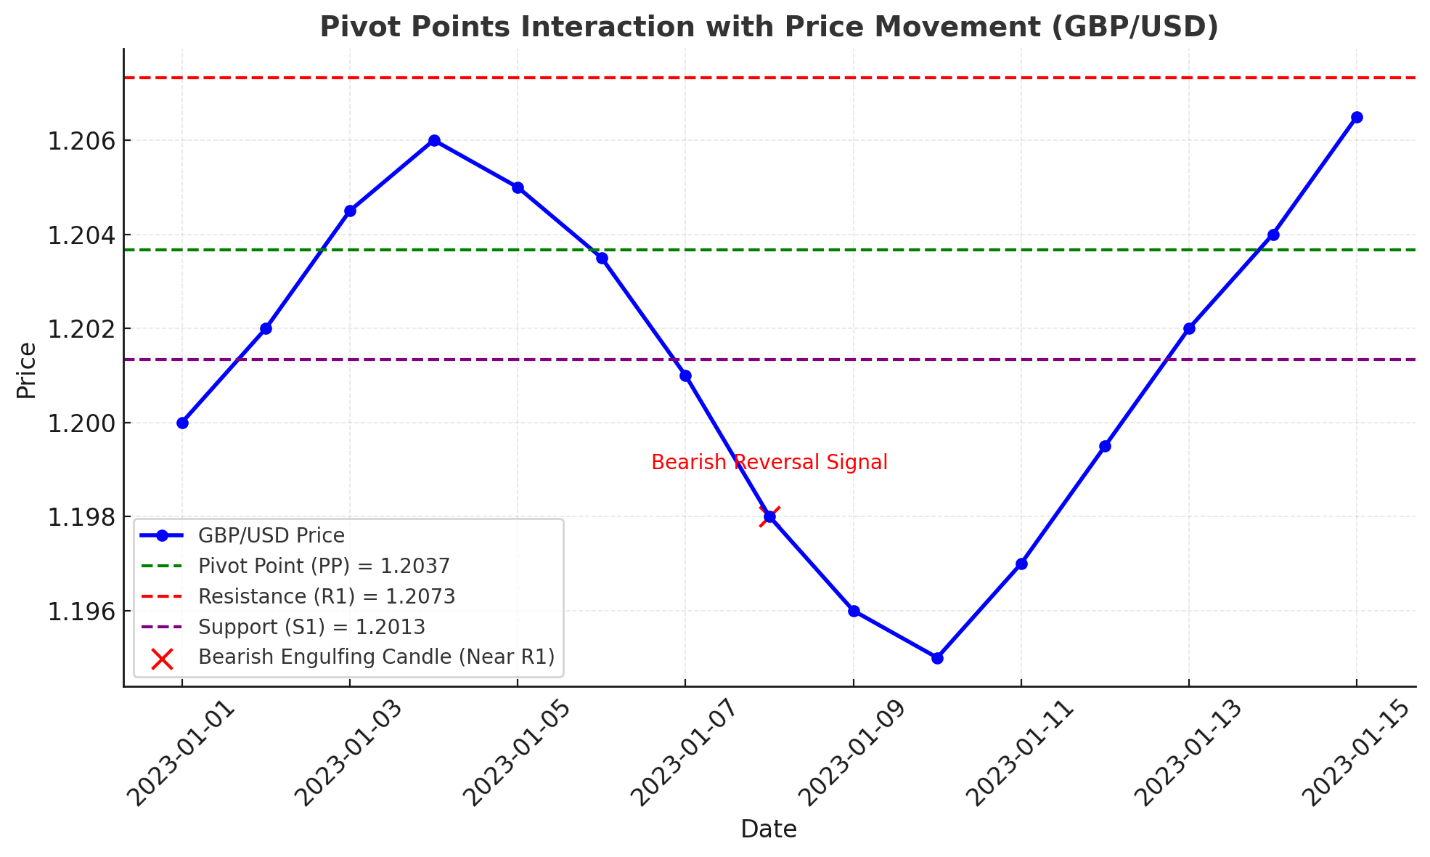
Here, you can see how pivot points interact with price movements on a dummy GBP/USD chart. PP, R1, and S1 levels are marked on the chart. A bearish engulfing candle is highlighted near R1, indicating a potential reversal toward the PP.
Pivot points are a popular tool in technical analysis due to their simplicity and effectiveness. But let’s explore their practical application better.
On the other hand, there are several limitations:
Adding pivot point indicators to MT5 or cTrader is quite easy.
Sign up in seconds for free, access your platform, and start trading with ease.
 $200 Oil Scenario: The Chain Reaction Across Markets
What happens if oil hits $200? See the impact on global markets, sectors, inflation, and which industries could win or lose.
Detail Biggest Manipulations in Financial Market History
Financial markets have seen their share of manipulation over the years. Here are seven of the biggest cases in modern history.
Detail Petrodollar System: Why It Still Matters
Energy markets depend on supply routes, currency systems, and trade infrastructure determine prices, inflation, and financial stability across the global economy.
DetailThen Join Our Telegram Channel and Subscribe Our Trading Signals Newsletter for Free!
Join Us On Telegram!


