


The Rounding Bottom and Rounding Top patterns, which are used to predict long-term trend reversals, are among the useful chart models for understanding how markets might behave over a certain period.
The Rounding Bottom typically indicates the end of a downtrend and the beginning of an uptrend, while the Rounding Top suggests the end of an uptrend and the start of a downtrend.
By reading our article, you can learn more about the Rounding Bottom and Rounding Top patterns.
The Rounding Bottom is a chart pattern where prices gradually decline to a low point and then slowly rise again. The pattern typically indicates that an asset is exiting a downtrend and preparing to enter a new uptrend.
In this formation, the price movements occur slowly and gradually, giving the bottom of the chart a rounded appearance. The pattern, which signals a long-term trend reversal, is frequently used in forex, stock, and commodity markets.
The Rounding Top is a chart pattern where prices gradually reach a peak level and then slowly start to decline. The pattern typically indicates that an asset's uptrend is coming to an end and a new downtrend is beginning.
In this formation, the price movements occur slowly and steadily, creating a noticeable rounding at the top of the chart. The pattern is particularly used to identify when a trend is weakening or ending, helping investors anticipate changes in market direction.
Rounding Bottom:
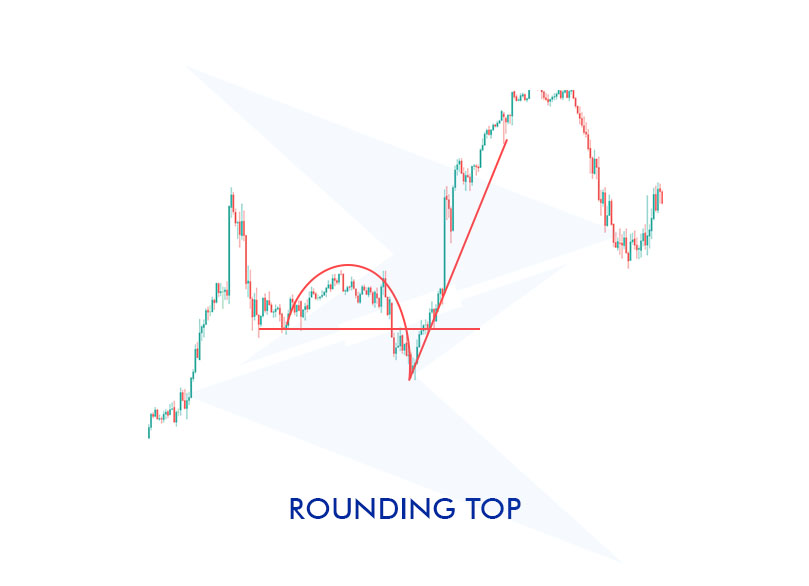
Rounding Top:
Using the Rounding Bottom pattern can be an effective strategy for predicting long-term trend reversals and making informed investment decisions. This pattern emerges when prices reach a low point, gradually recover, and signal the beginning of a new uptrend. Investors who identify this pattern often consider taking long positions.
To use the pattern effectively, it is essential to wait for it to fully form. During the formation process, which can take weeks or months, low trading volume at the bottom and increasing volume as prices recover are expected. The pattern is considered complete when the price breaks through the previous resistance, at which point long positions may be strengthened.
Let's explore the Rounding Bottom pattern with an example from the forex market. Suppose the EUR/USD pair has been in a downtrend for an extended period and finally drops to the 1.0800 level. After reaching this level, the pair's price begins to recover slowly and gradually. Over time, the price rises from the bottom and approaches the 1.1000 resistance.
In this example, when the EUR/USD pair reaches the bottom level, trading volume is usually low. However, as the pair's price recovers and approaches the 1.1000, the trading volume starts to increase. Finally, when the price breaks through the 1.1000 level, the Rounding Bottom pattern is completed.
Let's examine a similar scenario on the chart:
When prices hit a peak and then begin to progressively decrease, this is known as the Rounding Top pattern. Usually, it denotes the end of an upward trend.
After the pattern is fully formed, prices rise to the crest gradually. At the top, high trading activity is anticipated; however, as prices start to fall, a drop in volume might confirm that the pattern is still genuine.
When prices breach the prior support, the pattern is deemed complete, and short positions can then be reinforced.
Using an example, let's examine the Rounding Top pattern. Let's say that for an extended period of duration, the price of crude oil has been rising, reaching a level of $90. Following the achievement of this level, prices gradually start to decrease as the price movement progressively loses momentum. Prices eventually drop to $85 in this manner.
In this case, trading volume often peaks at the highest point of crude oil prices. But trading volume also steadily declines as prices start to fall. Finally, the Rounding Top pattern is completed when prices surpass the previous support level at $80.
Let's examine a similar chart:
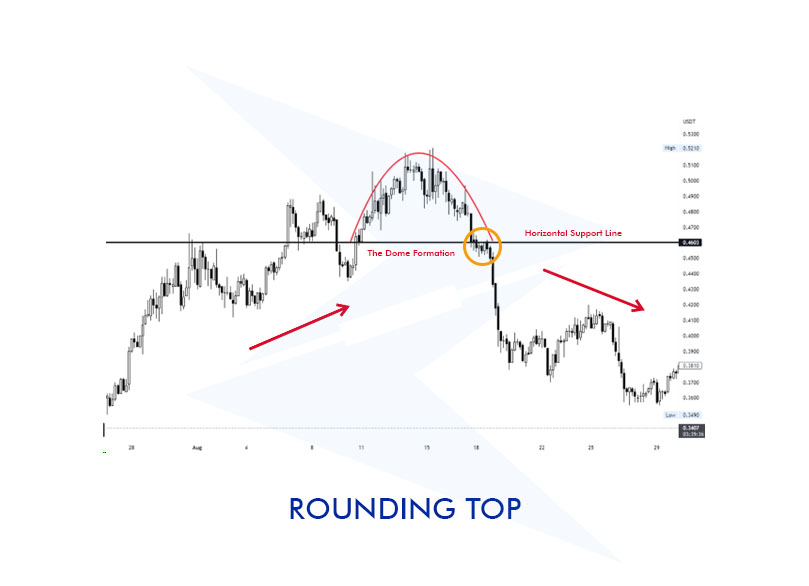
In the chart, a Rounding Top formation is observed where prices reach a peak and then gradually decline.
In the chart, trading volume increases as prices rise and begins to decrease as the peak is reached. This inverted volume pattern can be considered an important sign supporting the validity of the Rounding Top formation.
In the chart, a support is indicated during the downward movement of prices. This level can be defined as a point where prices may pause or react during the downtrend. If prices break this support line, the Rounding Top formation is considered complete, and the downtrend may further strengthen.
The table below highlights key distinctions to help you navigate see the differences between the Rounding Bottom and Rounding Top formations and help you compare them for better analysis.
|
Rounding Bottom |
Rounding Top |
|---|---|
| Signals the end of a downtrend and the beginning of an uptrend. | Signals the end of an uptrend and the beginning of a downtrend. |
| Forms a rounded, U-shaped bottom on the chart. | Forms a rounded, inverted U-shaped top on the chart. |
| Prices gradually decline to a low point and then slowly rise. | Prices gradually rise to a peak and then slowly decline. |
| Volume typically decreases as prices fall and increases as prices rise. | Volume is usually high as prices rise and decreases as prices fall. |
| Confirmed when prices break above the previous resistance. | Confirmed when prices break below the previous support. |
| Indicates a shift from bearish to bullish sentiment. | Indicates a shift from bullish to bearish sentiment. |
| Typically used to identify buying opportunities. | Typically used to identify selling opportunities. |
How is volume affected during a Rounding Bottom and Rounding Top?
During the Rounding Bottom formation, volume typically decreases at the beginning of the downtrend. As the price approaches the bottom level, the volume remains low. However, as the price begins to recover and approaches the resistance, volume increases. This increase indicates that the formation is complete and a new uptrend is beginning.
During the Rounding Top formation, volume increases as prices approach the peak. When the peak is reached, volume may be high, but as prices start to decline, the volume begins to decrease. This decrease can be a sign that supports the validity of the formation.
What should be done when the Rounding Bottom formation is completed?
When the Rounding Bottom formation is completed, investors usually consider opening long positions. The formation is considered complete when the price breaks the previous resistance, indicating the start of a new uptrend. In this case, long positions can be strengthened, and long-term profit opportunities can be explored.
What should be done when the Rounding Top formation is completed?
When the Rounding Top formation is completed, investors usually consider opening short positions. The formation is considered complete when the price breaks the previous support, indicating the start of a new downtrend. In this case, short positions can be strengthened, and positions can be closed to protect against potential losses.
Differences between a Rounding Bottom and a Cup with Handle?
While the Rounding Bottom and Cup & Handle formations share similar structures, there are important differences between them. The Rounding Bottom forms a U-shaped bottom, while the Cup with Handle formation typically includes a "cup" followed by a "handle" structure. The Cup with Handle formation is usually characterized by a shorter-term pullback or consolidation. Additionally, in the Cup with Handle formation, the handle is considered a buy signal for investors, a feature that is not present in the Rounding Bottom formation.
How can trading strategies be developed with Rounding Bottom and Rounding Top formations?
The Rounding Bottom formation is typically used to open long positions. The recovery of prices from the bottom and the break of the previous resistance is considered a suitable signal for buying. Investors can strengthen their positions by using increasing volume and other technical analysis tools along with this formation.
The Rounding Top formation is usually suitable for short positions. The gradual decline of prices after reaching the peak and breaking the support signals the need for short trades. Investors can make more informed decisions by supporting this formation with decreasing volume and other technical indicators.
How to avoid mistakes with the Rounding Bottom formation?
To avoid mistakes with the Rounding Bottom formation, it is important to be patient and wait for the formation to fully develop. Investors should avoid buying too early and wait for the price to break the previous resistance. Additionally, the volume increase should also support the formation. It is also important to validate the formation using other technical analysis tools.
How to avoid mistakes with the Rounding Top formation?
To avoid mistakes with the Rounding Top formation, it is important to wait for the formation to fully develop and confirm that the support is broken. Investors should avoid selling too early and carefully monitor price movements. Additionally, the decreasing volume should be considered a sign that confirms the validity of the formation. Supporting the formation with other technical analysis tools can help avoid false signals.
Sign up in seconds for free, access your platform, and start trading with ease.
 $200 Oil Scenario: The Chain Reaction Across Markets
What happens if oil hits $200? See the impact on global markets, sectors, inflation, and which industries could win or lose.
Detail Biggest Manipulations in Financial Market History
Financial markets have seen their share of manipulation over the years. Here are seven of the biggest cases in modern history.
Detail Petrodollar System: Why It Still Matters
Energy markets depend on supply routes, currency systems, and trade infrastructure determine prices, inflation, and financial stability across the global economy.
DetailThen Join Our Telegram Channel and Subscribe Our Trading Signals Newsletter for Free!
Join Us On Telegram!


