


Moving averages are indicators calculated by averaging the price of a financial instrument over a certain period. They are often used for following trends, position trading, and confirming signals from other technical analysis indicators.
While the moving average can give clues about price trends, it can also help identify points of support and resistance.
The moving average is inherently a lagging indicator. In other words, it is the result of price fluctuations, which means it is not used to make predictions about future price movements but to validate the analyses of the current state of the financial instrument.
Moving averages also form the basis of other popular technical analysis indicators such as Bollinger Bands and MACD. In particular, the 50-day moving average, 200-day moving average and RSI indicator analyses are among the most used methods to perform technical analyses of trading ecosystem.
The rest of our article deals with:
The day-to-day calculation is done by using the moving average formula. Each day's closing price coincides with a point on the chart. When the dots are connected, the emerging trend line turns into a chart that provides insights for investors.
The closing price of each new day naturally impacts moving average trends. When there is strong price action that breaks the trend line, it indicates a strong trading signal for traders. In most cases, moving average (MA) lines tend to become a support or resistance level for the current trends.
For example, you can see the 200-day moving average trend line acting as a support line, preventing the price from decreasing further.
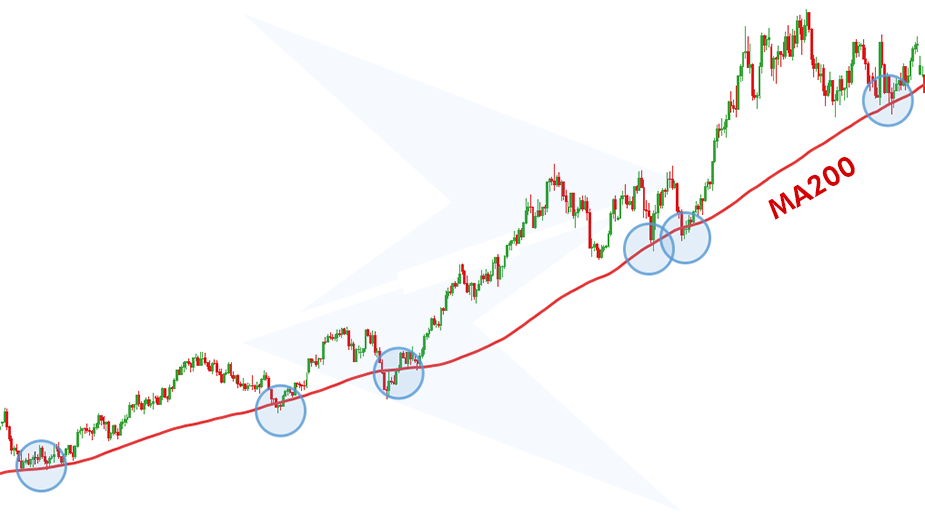
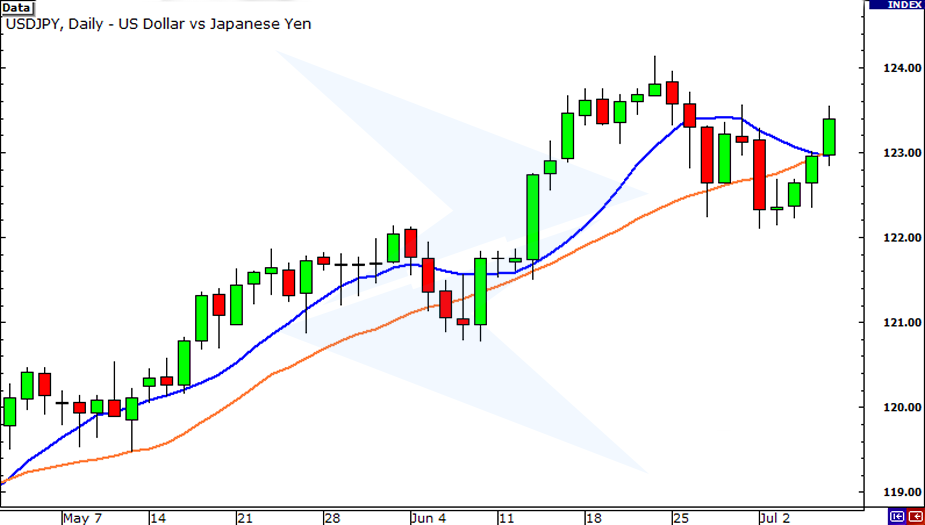
In an uptrend, moving averages can be a powerful tool to identify buying opportunities. When the price stays consistently above the moving average line, it signals a strong upward trend. For instance, a 50-day moving average crossing above the 200-day moving average, known as a "golden cross," suggests a bullish market sentiment. Traders might consider entering long positions when the price bounces off the moving average line, as seen in the example chart below.
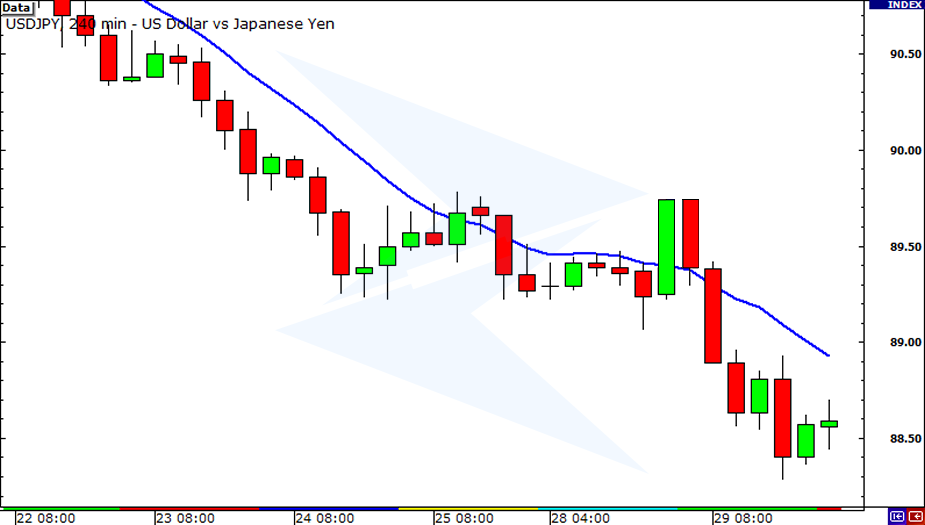
Conversely, in a downtrend, moving averages help traders identify potential selling opportunities. When the price remains below the moving average line, it indicates a prevailing downward trend. A "death cross," where the 50-day moving average falls below the 200-day moving average, often signals a bearish market sentiment. When the price action consistently fails to rise above the moving average, as seen in the chart below, it suggests a continuation of the downtrend.
The most common moving averages for technical analyses are:
The simple moving average (SMA) is the most commonly used type of moving average. It is calculated by averaging the daily closing prices of a financial product within a fixed period of time. For example, a 7-day SMA is determined by adding the closing prices from the last seven days and dividing the sum by seven.
To make it clearer with an example;
Let’s assume the symbol for the financial instrument is XYZUSD. The closing prices of XYZUSD over the last 7 days are as follows:
Since the 7-day simple moving average will be = (sum of 7-day closing prices / 7), 30.5/7= 4.36.
The simple moving average is more suitable for short-term market analyses. As the base period gets longer, the simple moving average will be less likely to make a meaningful contribution to your analyses. In fact, using the simple moving average for a long-term technical analysis can generate erroneous results.
The weighted moving average (WMA) gives more weight to the most recent days' prices when calculating the average of a financial instrument over a set time frame. Unlike the simple moving average, where each day's price has equal importance, the WMA places more emphasis on newer prices. Many analysts prefer this method because it considers recent price movements more relevant than older ones.
Let’s give another example;
Let’s assume once again our financial instrument is XYZUSD. The table below shows the 5-day closing prices of XYZUSD.
| Day | Closing Price | Weight |
| 1 | $91 | 1/15 |
| 2 | $90 | 2/15 |
| 3 | $89 | 3/15 |
| 4 | $88 | 4/15 |
| 5 | $90 | 5/15 |
Let's remind you of the weighted moving average (WMA) formula:
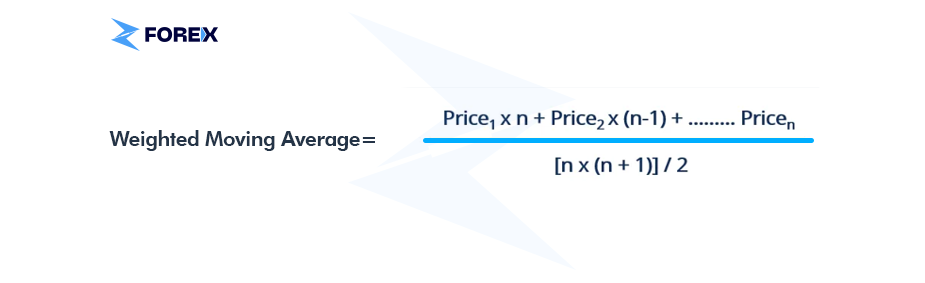
n = period
Let's revise the table according to the price table and weighted moving average formula and add a weighted average price column:
| Day | Closing Price | Weight | Weighted Average |
| 1 | $91 | 1/15 | $6.07 |
| 2 | $90 | 2/15 | $12 |
| 3 | $89 | 3/15 | $17.80 |
| 4 | $88 | 4/15 | $23.47 |
| 5 | $90 | 5/15 | $30 |
The weighted moving average of XYZUSD in this case is $30 + $23.47 + $17.80 + $12 + $6.07 = $89.34.
Exponential Moving Average (EMA) is a technical indicator that shows how the price of a security has changed over a period. Basically, price movements within a specified period are averaged, but more weight is given to recent price movements when doing the calculation.
Exponential Moving Average (EMA) works like Weighted Moving Average (WMA), but unlike WMA, it also averages the price figures from past days rather than attaching little importance to them. So, a 100-day exponential moving average would use all historical data, not just the last 100 days. This makes it a more valid analysis method.
EMA = K x (Current Price – Previous EMA) + Next EMA
K (Weight factor) = 2/(number of days+1)
Note:
When calculating the first EMA (since the previous EMA does not exist), the average of the prices, that is, the simple moving average, is taken. For more recent EMAs, the calculation is done according to the formula.
Weight factor for 21-Day EMA:
K21 = 2/(21+1) = 0.090 = 9%
Weight factor for 100-Day EMA
K100 = 2/(1100+1) = 0.019 = 1.9%
As can be inferred from the examples, the 21-day EMA gives 9.0% weight to the most recent price, while the 100-day EMA only gives it a merely 1.9% weight. Therefore, EMAs calculated for shorter periods are more sensitive to price movements in the markets than those calculated for longer periods.
The exponential moving average (EMA) is also analyzed and interpreted like a simple moving average. However, when analyzing trends, the exponential moving average (EMA) can provide a more precise analysis. While the EMA has a gradually ascending trend, it can be interpreted as a buy signal if the price of the instrument is close to the trend line of the EMA. If the price of the instrument is above the EMA while the EMA is in a downtrend, this can be interpreted as a sell signal.
The importance of moving averages extends beyond financial analysis to various fields due to their versatile applications. In financial analysis, MAs play a crucial role in identifying trends, determining support and resistance levels, and generating trading signals. MAs give traders and investors vital insights into the direction and momentum of asset values, allowing them to make better decisions on whether to purchase, sell, or retain investments.
MAs are widely used in technical analysis to ease price fluctuations and filter out noise from market data. Analyzing moving average crossovers and trends allows traders to identify potential entry and exit points in the market. This improves the timing of trading.
Moving averages have uses beyond finance, including:
Overall, moving averages are important because they provide a simple yet effective tool for analyzing trends, smoothing data, and making decisions in a variety of professions and businesses.
Moving averages can help you trade with overall trends, but no technical analysis is 100% accurate. They also help you identify points of support and resistance. For example, the exponential moving average (EMA) with an upward trend can act as a buffer for price drops. In an opposite scenario, when there is a falling EMA and there is an upward price movement on the relevant instrument, the EMA trend line can be expected to function as a point of “resistance”.
Moving averages, used extensively for technical analyses, also act as a reference to other trading analysis methods. For example, the intersection of 50-day and 200-day moving average is an important technical analysis indicator.
When the short-term moving average crosses the long-term moving average upwards, it is called the "golden cross". In technical analysis, golden cross is interpreted as a continuation of the rise of prices. Conversely, the short-term moving average crosses the long-term moving average downwards. This is called the "death cross". The realization of the death cross is interpreted as a falling trend in prices.
What does a moving average tell you?
It provides insights regarding the direction of a trend. It helps to see whether prices are rising, falling, or moving sideways.
What does moving average 5 mean?
A moving average of 5 typically refers to a calculation where the average of the last 5 data points in a series is taken. It provides a smoothed representation of recent price movements.
Which one is the best moving average?
The "best" MA depends on the specific trading strategy, timeframe, and market conditions. All MA types have their advantages for traders' preferences and objectives.
What does a day moving average mean?
A "day moving average" typically refers to an MA calculated over a specific number of days.
What is the 3 EMA strategy?
The "3 EMA strategy" is a trading strategy based on the Exponential Moving Average (EMA). In this strategy, traders use three EMAs with different periods to identify trends and potential entry or exit points in the market.
Sign up in seconds for free, access your platform, and start trading with ease.
 $200 Oil Scenario: The Chain Reaction Across Markets
What happens if oil hits $200? See the impact on global markets, sectors, inflation, and which industries could win or lose.
Detail Biggest Manipulations in Financial Market History
Financial markets have seen their share of manipulation over the years. Here are seven of the biggest cases in modern history.
Detail Petrodollar System: Why It Still Matters
Energy markets depend on supply routes, currency systems, and trade infrastructure determine prices, inflation, and financial stability across the global economy.
DetailThen Join Our Telegram Channel and Subscribe Our Trading Signals Newsletter for Free!
Join Us On Telegram!


