


One of the risks faced by traders in financial markets is a situation known as a "bull trap." A bull trap is particularly important for traders who rely on technical analysis and price movements in their trading.
The market appears to be continuing its upward trend, causing investors to open buy positions based on these false signals. However, shortly after, the market unexpectedly reverses, and investors experience losses.
A bull trap typically occurs when the market breaks through a key resistance level. Investors perceive this breakout as a sign that the upward trend will continue, prompting them to buy quickly. However, the price fails to remain above this level and begins to move downward again. This leads to investors caught in the bull trap losing their positions rapidly.
Identifying a bull trap can be quite challenging for investors because the market gives a false bullish signal, creating the impression of a buying opportunity. However, by using the right technical analysis tools and indicators, it is possible to spot a bull trap:
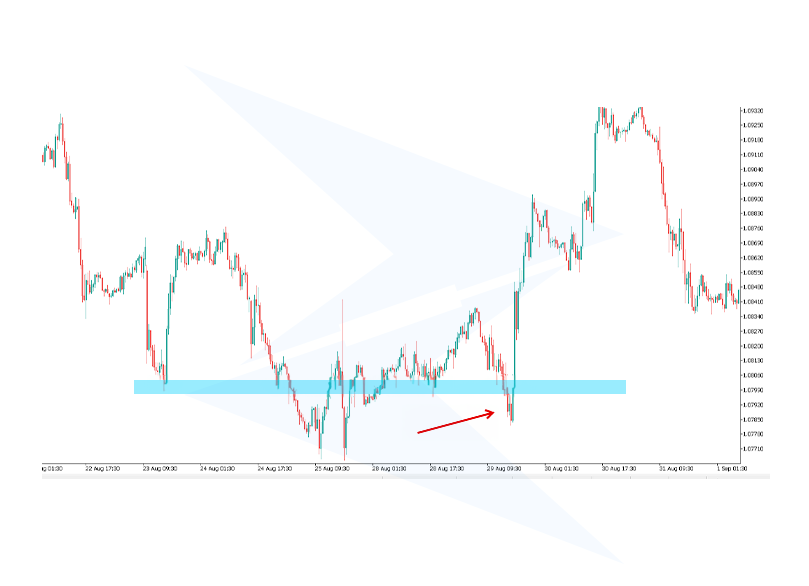
In the forex market, a bull trap is often seen on days when major economic data is released. For example, let's assume that the EUR/USD pair breaks a resistance level. Investors may interpret this breakout as a signal that the pair will continue to rise. However, following unexpectedly robust economic data from the U.S., the dollar strengthens, causing the EUR/USD to quickly retreat below the resistance level.
In this case, investors caught in the bull trap may be forced to close their long positions quickly, as the market moves in the opposite direction to their expectations.
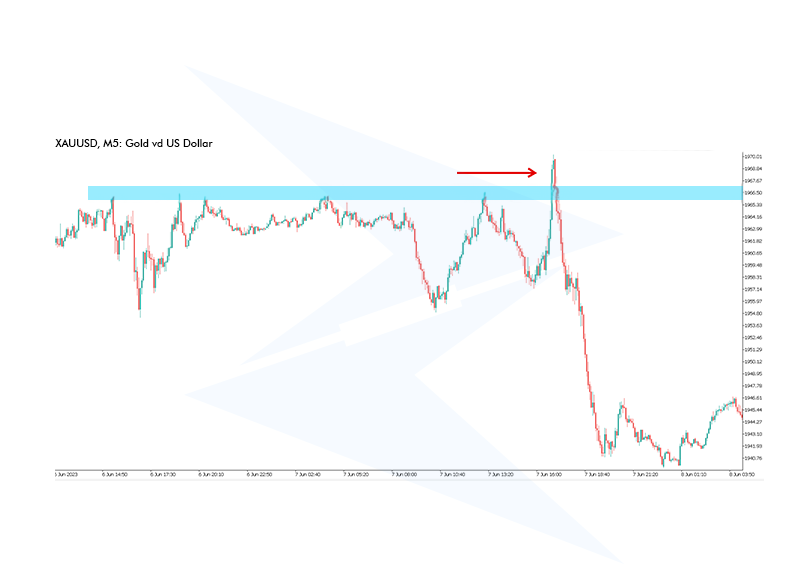
Another example can be seen in gold prices. For instance, the price of gold per ounce might be trading at a certain resistance level for a long time. Investors may believe that breaking this level would lead to a continued rise in gold prices.
However, this breakout often occurs with low trading volume, and the price rapidly retreats. When the gold price returns to its previous level, investors caught in the bull trap may have to exit their long positions at a loss.
In the chart above, you can see the bull trap in the EUR/USD pair. Now let's analyze the chart step by step:
To avoid getting caught in a bull trap, investors should follow a few key strategies. First, it’s important not to treat the breaking of resistance levels as a standalone signal. Just because the price breaks through a resistance level doesn’t always mean the uptrend will continue.
Trading volume is also an important indicator. A genuine uptrend is usually supported by high trading volume. If the resistance is broken with low volume, there’s a higher chance that the breakout is false, increasing the risk of falling into a bull trap.
Technical analysis tools can also be used to avoid bull traps. Indicators like RSI, MACD, and Stochastic Oscillator help identify whether the market is in overbought territory, which can signal a potential reversal and help prevent falling into a bull trap.
A bull trap misleads traders by giving a false bullish signal, causing them to open long positions. However, this movement quickly reverses, leading to losses for those investors.
On the other hand, a legitimate bullish move occurs when the price breaks through a resistance level strongly, supported by volume and technical indicators. In this case, the upward trend is more sustainable and reliable.
To better understand the differences between a bull trap and a legitimate bullish move, you can refer to the table below:
| Bull Trap | Legitimate Bullish Move |
| Low volume during breakout | High volume during breakout |
| Short-lived, quickly reverses | Sustained upward movement |
| Indicators in overbought territory, possible divergence | Indicators support the trend, no divergence |
| Breaks resistance briefly, then reverses | Breaks resistance and continues to rise |
| Driven by false optimism, often followed by sell-off | Supported by fundamental or positive market factors |
| High, due to false signals | Lower, due to confirmation from volume and indicators |
In a bull trap, the market gives a false bullish signal, encouraging investors to buy. A bear trap is the opposite; the market gives a false bearish signal, leading investors to sell and close their positions. However, shortly after, the price rises, and those who sold end up losing.
Both traps mislead investors about market trends, negatively affecting their positions. However, there are key points and signals to watch out for in each situation.
You can see the comparison between a bull trap and a bear trap in the table below:
| Bull Trap | Bear Trap |
| Appears as a breakout above resistance, then reverses | Appears as a breakdown below support, then reverses |
| Investors buy expecting further gains | Investors sell expecting further losses |
| Price quickly reverses downward | Price quickly reverses upward |
| Overbought signals, possible bearish divergence | Oversold signals, possible bullish divergence |
| High, as false breakout misleads buyers | High, as false breakdown misleads sellers |
| Low volume during the breakout | Low volume during the breakdown |
How can I identify a bull trap with MACD?
MACD is an effective indicator for spotting bull traps. If the price action shows an upward breakout while there is a divergence between the MACD line and the signal line (negative divergence), it may indicate a bull trap. In this case, while the price is rising, MACD shows a downward trend, signaling that the upward move might not be sustainable.
How can I identify a bull trap with RSI?
RSI is used to determine whether the market is in overbought territory. If the RSI rises above 70, signaling overbought conditions, the risk of a bull trap increases. Additionally, if the price rises while the RSI shows a downward trend (negative divergence), this can also indicate a bull trap. In this case, the price action could be a false upward move.
In what market conditions are bull traps more common?
Bull traps are more common in volatile and uncertain market conditions. The risk of a bull trap increases particularly in sideways markets or when the market is attempting to recover after a previous downtrend. In such situations, false upward signals may tempt investors into buying.
What should traders do if they fall into a bull trap?
If investors fall into a bull trap, they should quickly close their positions to minimize losses once they realize the price has reversed. Additionally, setting stop-loss orders to limit potential losses would be wise. After falling into a bull trap, it’s important to act quickly.
How can volume analysis help identify a bull trap?
Volume analysis is one of the best ways to detect a bull trap. A genuine uptrend is typically supported by high volume. However, if volume is low during the breakout, the likelihood of a false breakout (bull trap) increases. Upward moves with low volume tend to be short-lived and may quickly reverse.
What are the differences between a bull trap and a correction?
A bull trap lures investors into buying through a false upward move, and the price quickly reverses, leading to losses. A correction, on the other hand, is a short-term pullback within a long-term uptrend. Corrections are often seen as brief pauses before the trend continues. In a bull trap, the price rise is false, whereas in a correction, the price is expected to recover.
What typically happens in the market after a bull trap?
After a bull trap, the market typically experiences a rapid pullback. This situation can be intensified as investors rush to close their positions. As prices fall, the market may come under heavy selling pressure. It may take time for the market to establish a new trend, and investors should proceed cautiously.
Can a bull trap be a sign of a market bubble?
A bull trap alone is not necessarily a sign of a market bubble, but the appearance of multiple bull traps in succession and the market continuously misleading investors with false upward moves can be an indication of a bubble. If the market shows persistent gains without underlying fundamentals, supported by multiple bull traps, it could signal the presence of a market bubble.
Sign up in seconds for free, access your platform, and start trading with ease.
 $200 Oil Scenario: The Chain Reaction Across Markets
What happens if oil hits $200? See the impact on global markets, sectors, inflation, and which industries could win or lose.
Detail Biggest Manipulations in Financial Market History
Financial markets have seen their share of manipulation over the years. Here are seven of the biggest cases in modern history.
Detail Petrodollar System: Why It Still Matters
Energy markets depend on supply routes, currency systems, and trade infrastructure determine prices, inflation, and financial stability across the global economy.
DetailThen Join Our Telegram Channel and Subscribe Our Trading Signals Newsletter for Free!
Join Us On Telegram!


