


Chart patterns are an important topic for any investor, but if you're actively trading, understanding these patterns becomes essential for effective trading. Recognizing continuation and reversal patterns can help you anticipate market movements and make informed decisions, enhancing your trading strategy.
This article will delve into the most important continuation and reversal patterns in technical analysis, providing real-world examples and practical applications. By mastering this topic, you can improve your ability to predict price trends and better manage your trades.
Continuation patterns are formations that indicate a trend is likely to continue after a brief consolidation period. Here are some common types:
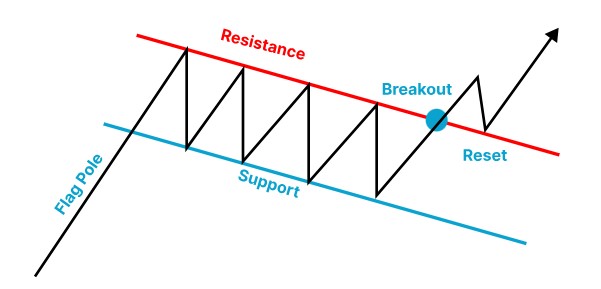
A flag pattern forms after a sharp price movement, followed by a period of consolidation that moves in the opposite direction of the initial trend. This consolidation phase creates a rectangular shape that resembles a flag on a pole. The pattern is completed when the price breaks out in the direction of the original trend.
Example:
Imagine a stock that rapidly rises from $50 to $70. Following this upward movement, the price consolidates between $65 and $68, forming a flag pattern. A breakout above $70 would signal the continuation of the upward trend, potentially leading to higher prices.
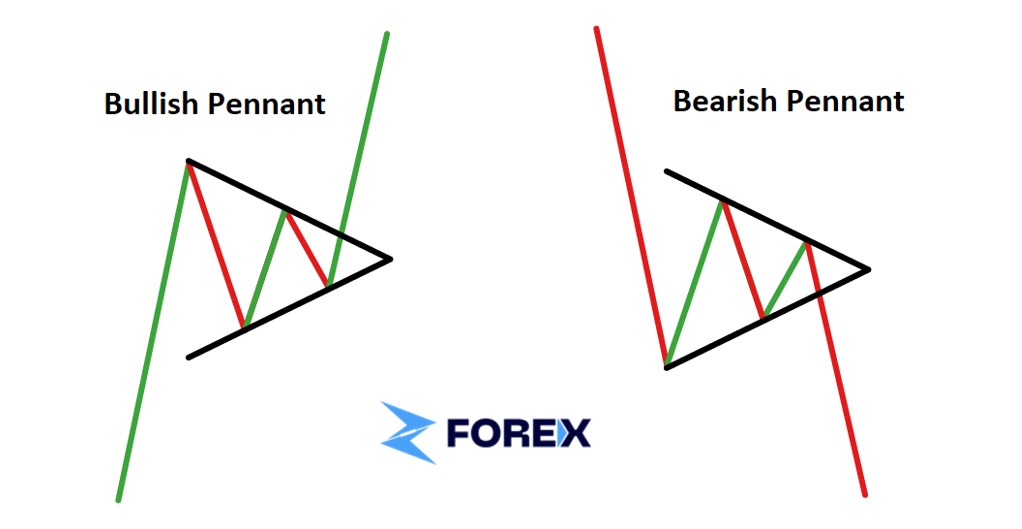
A pennant pattern is similar to a flag pattern but forms a symmetrical triangle instead of a rectangle. After a sharp price movement, the price consolidates with converging trendlines, indicating a brief pause before the trend continues.
Pennants are typically short-term patterns that last from a few days to a few weeks.
Example:
Consider a forex pair that rises from 1.2000 to 1.2500. The price then consolidates, forming a pennant with trendlines converging between 1.2450 and 1.2480. A breakout above 1.2500 suggests the continuation of the upward trend, with the next target potentially around 1.2700.
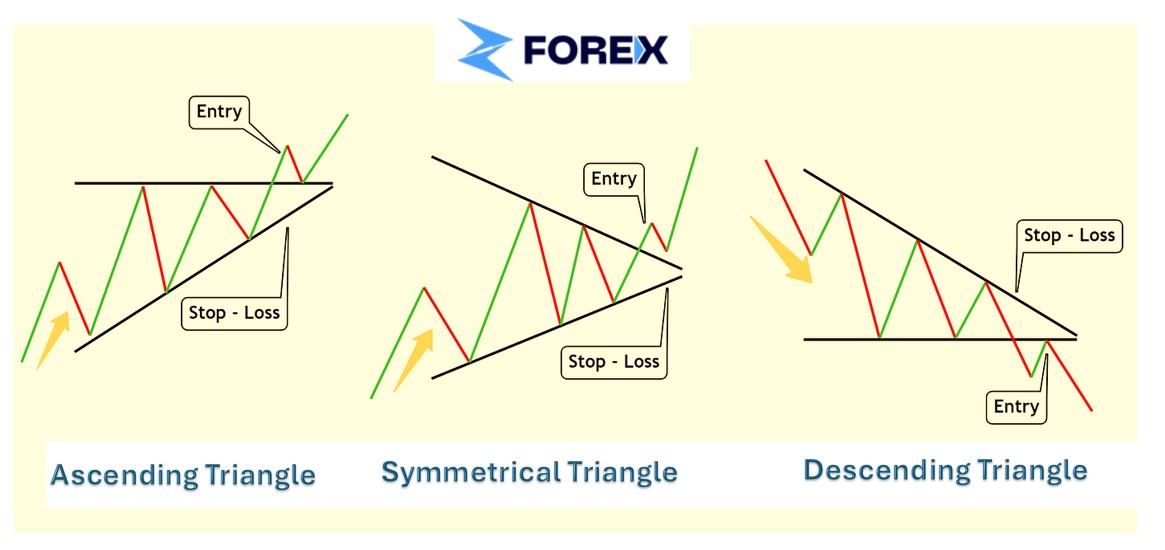
Example:
For an ascending triangle, imagine a stock trending upwards and reaching a resistance level at $100 multiple times while forming higher lows at $90, $92, and $95. A breakout above $100 would signal a continuation of the upward trend.
For a descending triangle, consider a stock trending downwards, repeatedly hitting support at $50 while forming lower highs at $60, $55, and $52. A breakout below $50 would indicate a continuation of the downward trend.
Reversal patterns signal a change in the direction of the prevailing trend, indicating that the current trend is likely to reverse. These patterns are crucial for traders to identify potential turning points in the market.
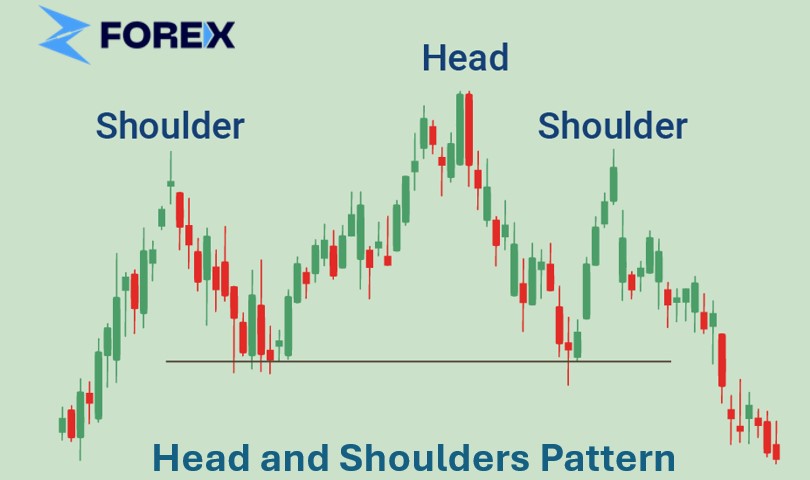
The head and shoulders pattern is a well-known reversal pattern that predicts a trend reversal from bullish to bearish. It consists of three peaks: a central peak (head) flanked by two smaller peaks (shoulders).
The neckline, drawn by connecting the lows between the peaks, serves as the support level. The pattern is confirmed when the price breaks below the neckline.
Example:
Consider a stock rising to $100 (left shoulder), then surging to $120 (head), and finally reaching $110 (right shoulder). If the lows between these peaks are at $90 and $95, the neckline is drawn at these levels. A break below $95 signals a bearish reversal.
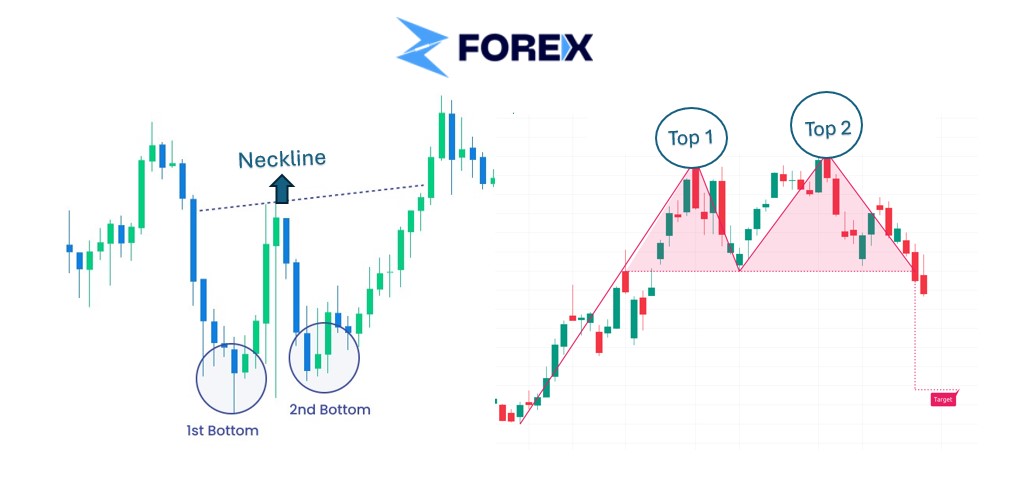
Double Top: This pattern forms after an uptrend, characterized by two peaks at approximately the same level, indicating resistance. It suggests a potential reversal to a downtrend.
Double Bottom: This pattern appears after a downtrend, featuring two troughs at roughly the same level, indicating support. It signals a potential reversal to an uptrend.
Example
For a double top, imagine a forex pair rising to 1.3000 twice but failing to break above, and then dropping below the interim low of 1.2800, confirming the pattern. For a double bottom, consider a commodity dropping to $50 twice, failing to go lower, and then rising above the interim high of $55, indicating a bullish reversal.
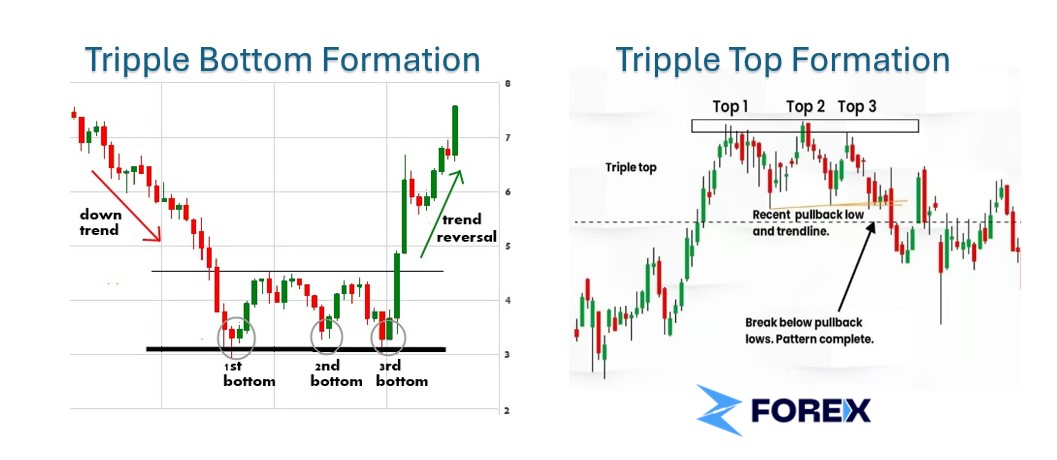
Triple Top: Just like to the double top, but with three peaks at the same level, indicating a stronger resistance and a higher likelihood of a bearish reversal.
Triple Bottom: Just like to the double bottom, but with three troughs at the same level, indicating stronger support and a higher likelihood of a bullish reversal.
Example:
For a triple top, suppose a stock hits $100 three times, forming peaks, and then drops below $90, signaling a bearish reversal. For a triple bottom, imagine a stock dropping to $50 three times and then breaking above $60, indicating a bullish reversal.
| Aspect | Continuation Patterns | Reversal Patterns |
| Definition | Patterns indicating that the current trend will continue | Patterns indicating a change in the current trend direction |
| Market Trend | Confirms the existing trend (uptrend or downtrend) | Signals the end of an existing trend and the start of an opposite trend |
| Common Patterns | Flag, Pennant, Ascending Triangle, Descending Triangle | Head and Shoulders, Double Top, Double Bottom, Triple Top, Triple Bottom |
| Formation | Formed during a trend, after a brief consolidation period | Formed at the end of a trend, indicating a potential reversal |
| Volume | Volume typically decreases during the consolidation phase | Volume often increases during the formation and breakout of the pattern |
| Trader Sentiment | Traders expect the trend to resume after a brief pause | Traders anticipate a trend reversal and position accordingly |
| Key Characteristics | Sharp price movement followed by consolidation and continuation after breakout | Pattern formation indicates exhaustion of the current trend and reversal confirmed after breakout |
| Entry Point | Enter trades in the direction of the trend after pattern confirmation | Enter trades in the opposite direction of the trend after pattern confirmation |
Successfully integrating continuation and reversal patterns into your trading strategy requires a structured approach and careful analysis. Here's how:
Start by identifying a potential continuation or reversal pattern on your charts. Use multiple timeframes to confirm the pattern’s validity. For example, if you spot a flag pattern on a daily chart, check the 4-hour or weekly charts for confirmation.
Don’t rush into trades based on incomplete patterns. Wait for the pattern to complete and confirm through a breakout or a breakdown. For instance, a head and shoulders pattern is only confirmed when the price breaks below the neckline.
Confirm the strength of the pattern using volume data. A valid breakout is often accompanied by a surge in trading volume, indicating strong market interest.
Set Entry and Exit Points: Clearly define your entry and exit points based on the pattern. For continuation patterns, enter the trade at the breakout point. For reversal patterns, enter after the pattern is confirmed.
Use other technical indicators like RSI, MACD, or moving averages to confirm the pattern. For example, a bullish flag pattern supported by an RSI indicating oversold conditions is more reliable.
Patterns are less reliable in sideways or choppy markets. Focus on identifying patterns in trending markets where they are more likely to hold.
Review past charts to see how well the patterns have worked in similar market conditions. This historical perspective can help in assessing the reliability of the current analysis.
Flag Pattern in Forex
Suppose you identify a bullish flag pattern on the EUR/USD pair at 1.1200, with the flagpole starting at 1.1000. The pattern consolidates between 1.1150 and 1.1200. A breakout above 1.1200, confirmed by high volume, signals a continuation of the uptrend. You enter a long trade at 1.1210, with a stop-loss at 1.1150 and a target at 1.1300.
Head and Shoulders in Stocks
Imagine spotting a head and shoulders pattern on a stock trading at $150 (left shoulder), $170 (head), and $160 (right shoulder), with a neckline at $140. A break below $140 confirms the pattern. You short the stock at $139, set a stop-loss at $145, and aim for a target of $120.
Continuation patterns indicate that the existing trend will resume after a brief consolidation. Examples include flag, pennant, and triangle patterns. Reversal patterns, on the other hand, signal a change in the direction of the prevailing trend, such as head and shoulders, double tops, and double bottoms.
Confirm the validity of a chart pattern by looking for a breakout or breakdown accompanied by a significant increase in volume. Additionally, using technical indicators like RSI, MACD, and moving averages can help verify the pattern’s reliability.
These patterns can be identified on various timeframes, but longer timeframes like daily or weekly charts generally provide more reliable signals. Shorter timeframes like 15-minute or hourly charts can also be used but may produce more false signals.
Yes, chart patterns can be applied to a wide range of assets, including stocks, forex, commodities, and cryptocurrencies. The principles of technical analysis remain consistent across different markets.
High volume during a breakout confirms the pattern’s validity and indicates strong market interest. Conversely, low volume can suggest a weak or false breakout, making the pattern less reliable.
Common mistakes include misidentifying patterns, ignoring volume analysis, entering trades before the pattern is confirmed, and failing to set proper stop-loss levels. Traders should also be cautious of patterns forming in choppy or sideways markets.
Sign up in seconds for free, access your platform, and start trading with ease.
 $200 Oil Scenario: The Chain Reaction Across Markets
What happens if oil hits $200? See the impact on global markets, sectors, inflation, and which industries could win or lose.
Detail Biggest Manipulations in Financial Market History
Financial markets have seen their share of manipulation over the years. Here are seven of the biggest cases in modern history.
Detail Petrodollar System: Why It Still Matters
Energy markets depend on supply routes, currency systems, and trade infrastructure determine prices, inflation, and financial stability across the global economy.
DetailThen Join Our Telegram Channel and Subscribe Our Trading Signals Newsletter for Free!
Join Us On Telegram!


