


The Double Top and Double Bottom formations are among the chart patterns that are effective in predicting trend reversals. Widely used by traders, these patterns can help you understand when a new trend might be starting.
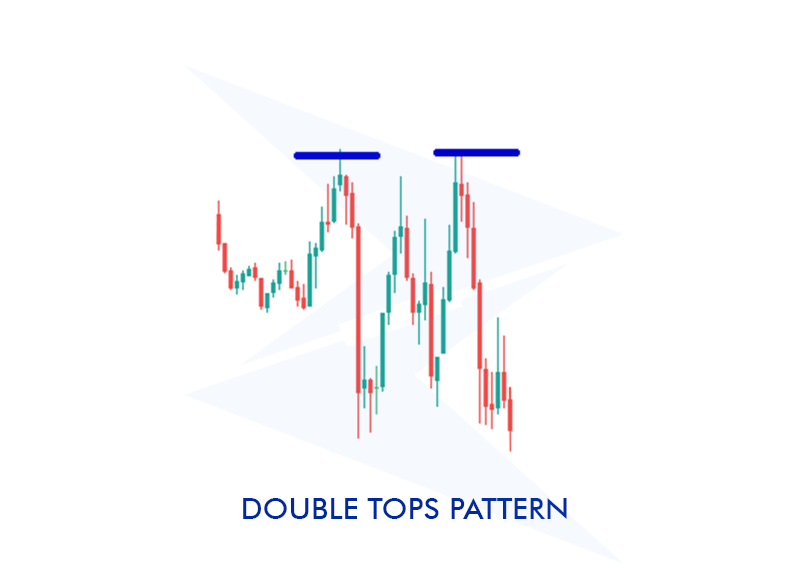
The Double Top formation typically signals the end of an uptrend. It occurs when prices reach the same level twice but fail to break through, resulting in a pullback.
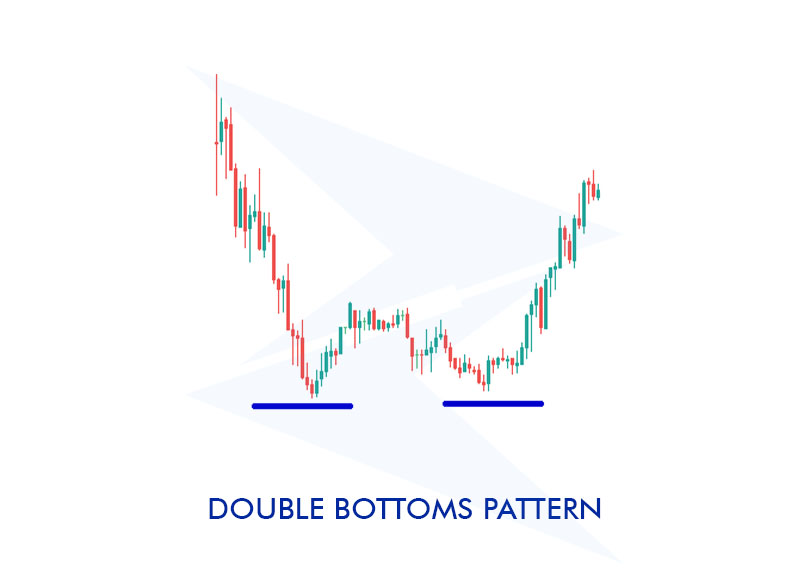
Conversely, the Double Bottom pattern indicates the end of a downtrend and the potential start of an uptrend. This pattern forms when prices hit the same low level twice without breaking below it.
In this article, we will take a detailed look at the Double Top and Double Bottom formations and provide insights on how traders can effectively use these patterns.
The Double Top pattern is a technical analysis chart that indicates a potential end to an upward trend when prices reach the same level twice but fail to surpass it.
During the formation of the Double Top, prices first reach a peak and then pull back before rising again to form a second peak at a similar level. However, this second peak does not surpass the first one, and prices begin to fall again. For the pattern to be considered complete, the prices must break below the lowest point between the two peaks (the neckline).
The pattern typically signals the beginning of a downward trend. Traders may view the break of the neckline as a signal to take a short position.
A chart that shows the end of a downtrend and the possible beginning of an uptrend is called a double bottom pattern. It develops when prices move upward after hitting the same low level twice without going below it.
The initial bottom is reached by prices, after which there is a brief increase. Subsequently, prices decline once more, creating a secondary bottom near the initial low point. The prices start to rise again when the second low fails to surpass the first. When the price breaks above the neckline, the pattern is finished. One could interpret this breakthrough as the start of an upward trend.
In the Double Top pattern, prices essentially reach the same level twice and then pull back. For example, imagine an asset's price reaching $100, then pulling back to $95. Later, it rises again to $100, but fails to break through and starts to decline. In this scenario, if there's a break below the $95 level, it confirms the Double Top pattern.
In the chart below, we can observe this:
In the Double Bottom pattern, prices reach the same low level twice but fail to break below it, leading to an upward trend.
Let’s analyze this with an example: Suppose the price drops to $50, then recovers and rises to $55. After that, the price drops back to $50 again but fails to break below this level and starts to rise again. In this case, if there is a breakout above the $55 level, the Double Bottom pattern is confirmed.
Let's walk through this on a chart:
| Step | Double Top | Double Bottom |
| Identify the Trend Direction | Forms at the end of an uptrend. | Forms at the end of a downtrend. |
| First Peak or Bottom | The price creates a peak and then pulls back. | The price makes a bottom and then recovers. |
| Second Peak or Bottom | The price rises again but fails to surpass the first peak and pulls back again. | The price falls again but fails to break the first bottom and starts rising again. |
| Neckline | Identify the lowest point between the two peaks; this level is the neckline. | Identify the highest point between the two bottoms; this level is the neckline. |
| Monitor the Breakout | A break below the neckline indicates the beginning of a downtrend. | A break above the neckline indicates the beginning of an uptrend. |
Is a double top bullish or bearish?
A double top formation is bearish. The formation typically appears when a price touches a certain resistance level twice and then starts to decline.
What is the psychology behind the double top?
The trading psychology behind a double top formation stems from the belief among investors that the price will not break through the resistance level. This leads to increased selling pressure in the market, indicating a downward trend in prices.
How to find a double bottom target?
To find the target of a double bottom formation, the distance from the bottom of the formation to the neckline is measured, and this distance is then added to the neckline.
What is the difference between a double top and a double bottom?
The difference between a double top and a double bottom formation is that one indicates a bearish trend, while the other indicates a bullish trend. A double top formation suggests that prices have failed to rise and will likely fall, whereas a double bottom formation indicates that prices have stopped falling and are likely to rise.
What confirms a double bottom?
The most important factor confirming a double bottom formation is the price breaking above the neckline. This breakout validates the formation and suggests that an upward trend may begin.
Sign up in seconds for free, access your platform, and start trading with ease.
 $200 Oil Scenario: The Chain Reaction Across Markets
What happens if oil hits $200? See the impact on global markets, sectors, inflation, and which industries could win or lose.
Detail Biggest Manipulations in Financial Market History
Financial markets have seen their share of manipulation over the years. Here are seven of the biggest cases in modern history.
Detail Petrodollar System: Why It Still Matters
Energy markets depend on supply routes, currency systems, and trade infrastructure determine prices, inflation, and financial stability across the global economy.
DetailThen Join Our Telegram Channel and Subscribe Our Trading Signals Newsletter for Free!
Join Us On Telegram!


