


The Head and Shoulders pattern is a widely used technical analysis tool that is effective in predicting trend reversals. It is particularly useful in identifying when an uptrend is about to end and a downtrend is about to begin.
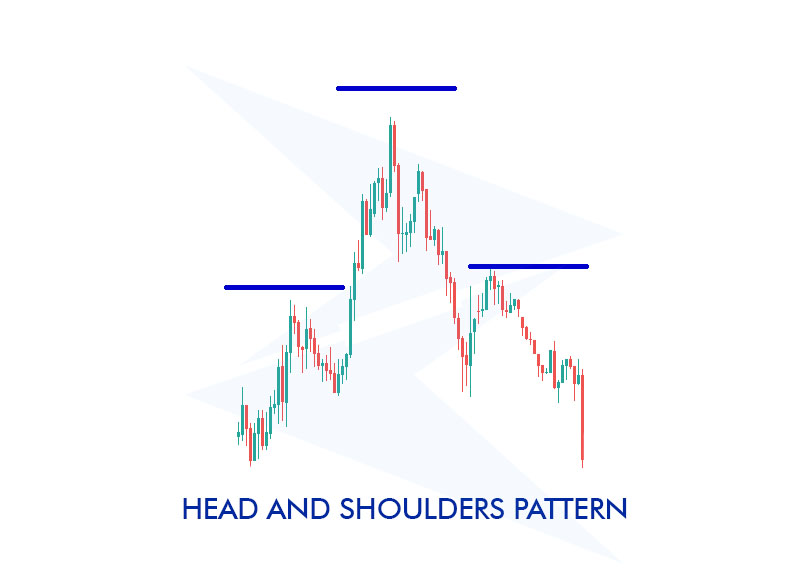
The name of the pattern comes from its resemblance to the head and shoulders of a human figure when viewed on a chart. Initially, the price rises to form a peak (the left shoulder), followed by a slight pullback. Then, the price climbs to a higher peak (the head) before retreating again. Finally, the price rises to a third peak (the right shoulder), which is similar in height to the first peak.
In this article, you will find detailed insights into the Head and Shoulders pattern and how it can be used in trading strategies.
The Head and Shoulders pattern is a chart model used in technical analysis to predict trend reversals. It typically indicates the end of an uptrend and the beginning of a downtrend.
The formation consists of three peaks: the first peak is referred to as the left shoulder, the middle peak forms the head, and the final peak is the right shoulder. The left and right shoulders are usually of similar height, while the head represents the highest point.
The pattern is completed when the support level, known as the neckline, is broken. This break is generally interpreted as a signal that the trend is about to reverse.
In its simplest definition, the Inverse Head and Shoulders pattern is the reverse version of the Head and Shoulders pattern. It shows the end of a downtrend and the potential beginning of an uptrend.
The three troughs that together make up the pattern are the head, the left shoulder, and the right shoulder. The first trough is called the left shoulder. The head is the lowest position, while the left and right shoulders are usually around equal depth.
When the neckline breaks to the upside in this type of pattern, the breakout occurs. There should be an upward rise next to the breakthrough.
To identify a Head and Shoulders pattern, you can follow these steps:
Here are the steps you can follow to trade using the Head and Shoulders pattern:
The Head and Shoulders pattern consists of three phases. First, let's try to understand these phases in the chart below:
At this point, we can draw a neckline by connecting the low points of the left and right shoulders. The line, which is usually horizontal or slightly inclined, represents the support level of the pattern.
What does the Head and Shoulders pattern tell you?
The Head and Shoulders pattern typically indicates that an uptrend is coming to an end and a downtrend may be starting. In other words, it signals that market participants' confidence in a particular asset is waning, and sellers are becoming more dominant.
Can the Head and Shoulders turn bullish?
The Head and Shoulders pattern is typically considered a bearish signal, but the Inverse Head and Shoulders pattern indicates the beginning of an uptrend. In this case, the pattern is considered bullish.
What happens after a head and shoulders pattern?
After the Head and Shoulders pattern is completed, a downtrend usually begins. Prices continue downward after breaking below the neckline, signaling investors to open short positions.
Can a head and shoulders pattern fail?
Yes, the Head and Shoulders pattern can fail. If there are false breakouts or the pattern is not fully completed, the expected price movement may not occur.
Is the Head and Shoulders pattern reliable in Forex?
The Head and Shoulders pattern is widely used in the forex market and is generally considered reliable. However, it is important to validate the pattern with other technical indicators to increase its effectiveness.
How do you draw the neckline in a Head and Shoulders pattern?
The neckline is drawn by connecting the lows of the left and right shoulders. It is usually horizontal or slightly sloped and represents the support level that prices are expected to break once the pattern is complete.
Sign up in seconds for free, access your platform, and start trading with ease.
 $200 Oil Scenario: The Chain Reaction Across Markets
What happens if oil hits $200? See the impact on global markets, sectors, inflation, and which industries could win or lose.
Detail Biggest Manipulations in Financial Market History
Financial markets have seen their share of manipulation over the years. Here are seven of the biggest cases in modern history.
Detail Petrodollar System: Why It Still Matters
Energy markets depend on supply routes, currency systems, and trade infrastructure determine prices, inflation, and financial stability across the global economy.
DetailThen Join Our Telegram Channel and Subscribe Our Trading Signals Newsletter for Free!
Join Us On Telegram!


