


In this article, we will explore how to analyze the market using technical analysis, which is a crucial part of financial markets. MetaTrader offers tools and helpful indicators that make it easy to perform.
Let's take a look at how to adjust the presentation of required data:
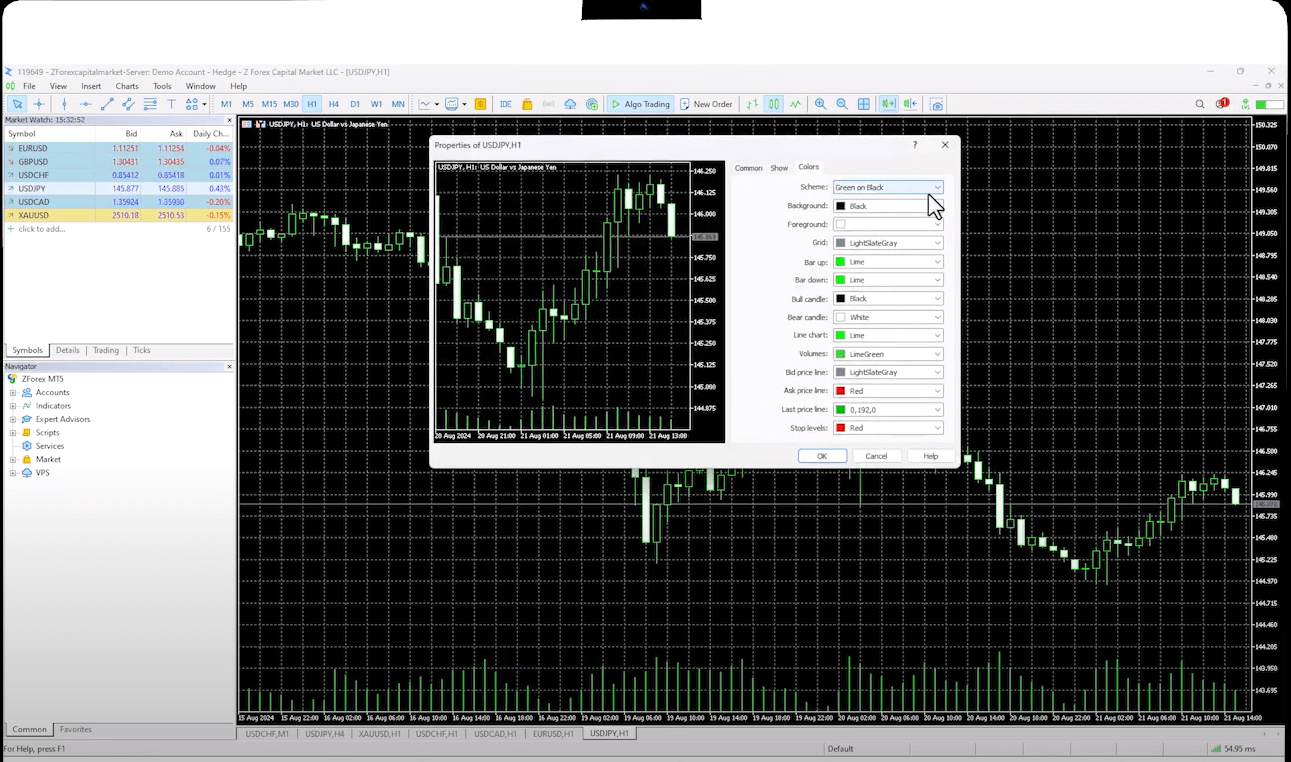
You can change the color of the chart by right-clicking and selecting ''Properties.''
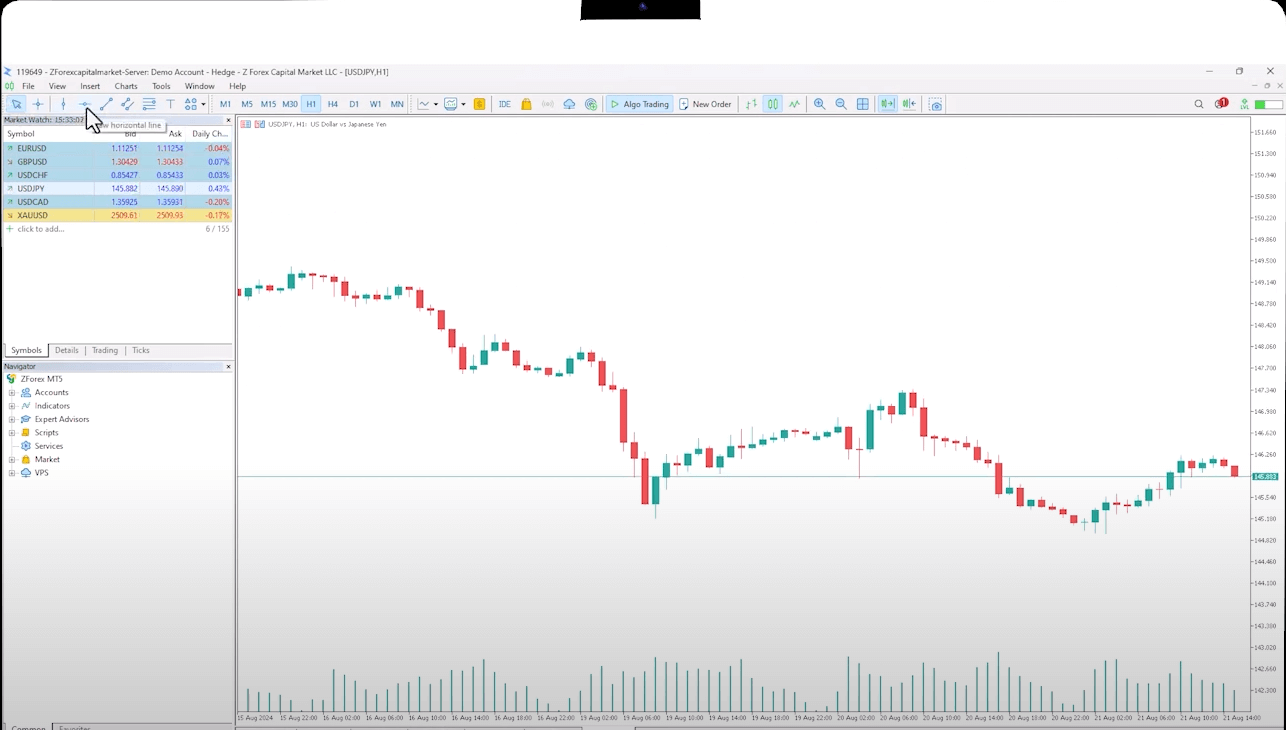
You can adjust the support and resistance lines just how you like, from the upper left menu. You can change their place, color, and thickness.
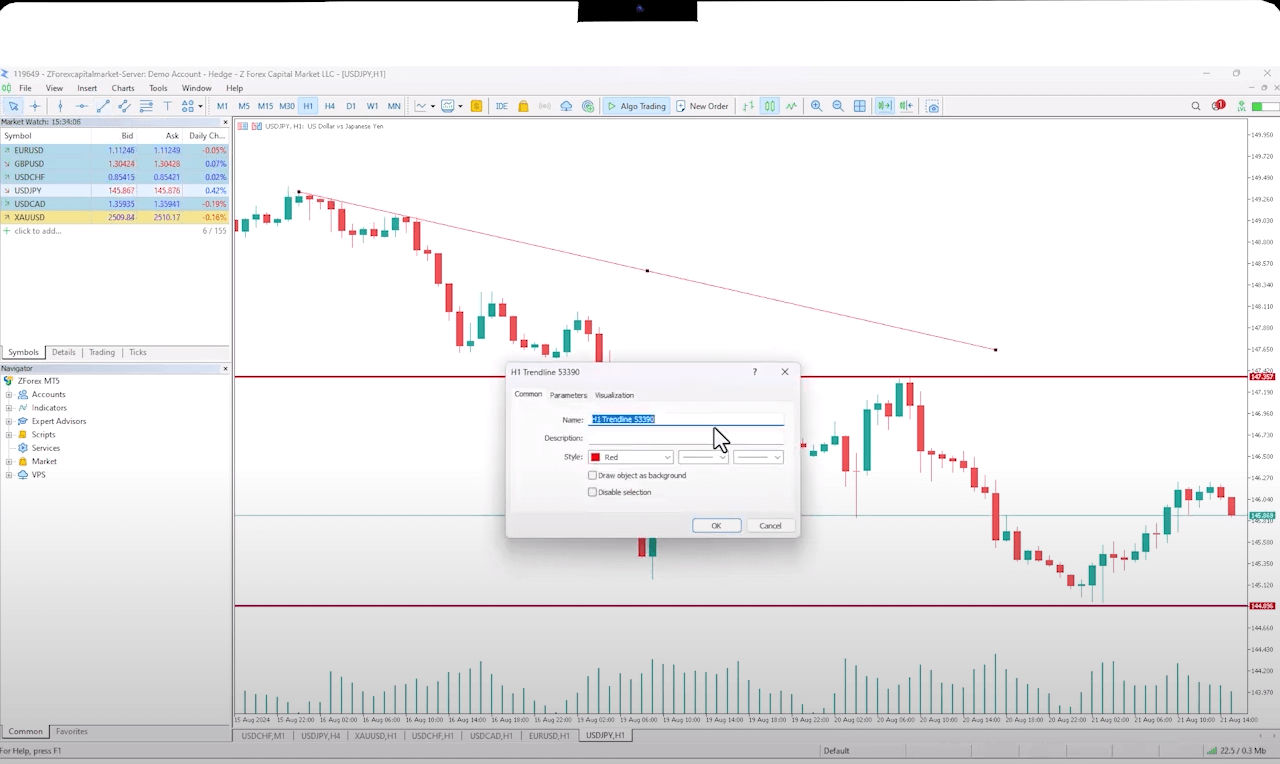
Among the other line works we can use is this indicator that helps us draw a Trendline. We can select the Trendline from the marked area. Once the line is set, you can right-click to modify its color and thickness.
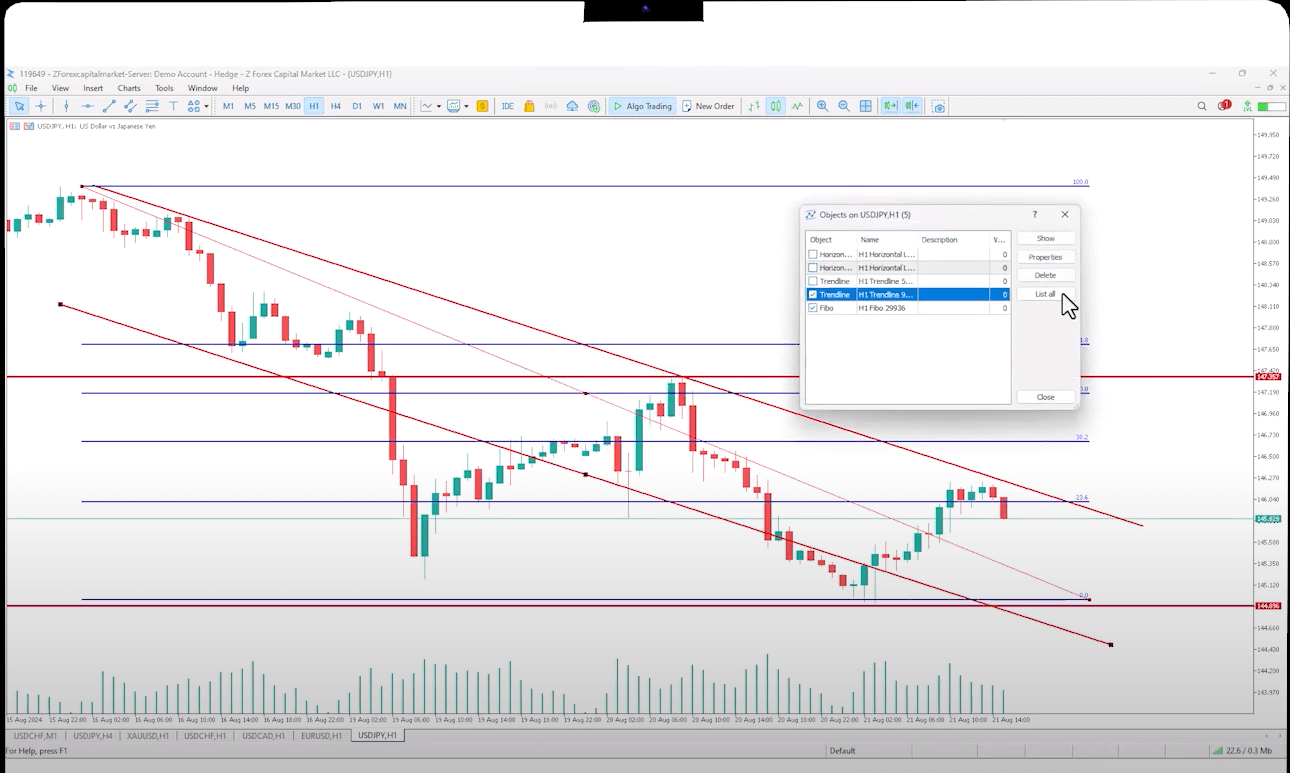
You can use the control button in the modify section to duplicate the trendline. By holding down the CTRL key, you can copy the line in the same manner whenever you want to adjust the line's position. You can also draw using Fibonacci tools among technical indicators in this way.
If you have too much data on the chart, you can view the elements on the chart individually by right-clicking. You can delete the data you want from the same place as well.
MT5 offers many indicators that assist in making buying and selling decisions. You can find these indicators under the Indicators option in the Insert menu. Here, you have access to a wide range of specialized indicators, including trends, oscillators, and volume indicators.
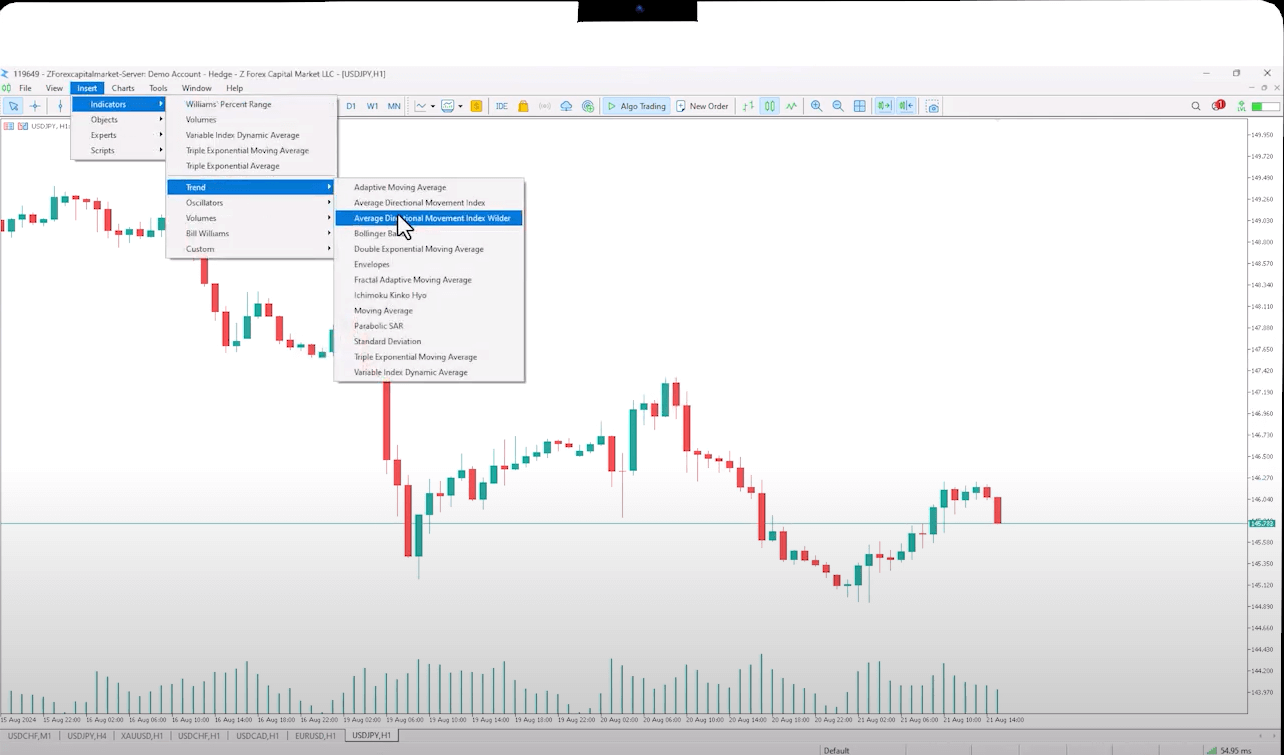
Here's an example with a Bollinger Band indicator:
If you need to adjust the parameters, simply double-click on the line and enter the new values.
From adjusting chart presentations to drawing trendlines and utilizing indicators like Bollinger Bands, MT5 provides a wide range of customization options. These tools help you visualize data more effectively and make strategic buy or sell decisions.
Sign up in seconds for free, access your platform, and start trading with ease.

 How Index Futures Influence the Stock Market Open
How do index futures influence the stock market open? Learn what pre-market moves reveal about opening prices, market sentiment, and trader psychology.
Detail What Is the Nasdaq?
What is the Nasdaq? Learn how the Nasdaq Composite Index works, which stocks it includes, and what influences its performance.
Detail What Is the FTSE 100?
The FTSE 100 tracks the largest companies listed on the London Stock Exchange. Explore how it is calculated and what influences its performance.
DetailThen Join Our Telegram Channel and Subscribe Our Trading Signals Newsletter for Free!
Join Us On Telegram!


