


Achieving success in financial markets requires complex analysis methods and strategies. Investors use various technical analysis tools to understand price movements and market trends, one of which is the indicator known as the Commodity Channel Index.
CCI is typically used to evaluate the current momentum of the market. By utilizing this indicator, investors can determine whether an asset's price is in line with the current trend or identify signals of overvaluation or a potential downturn.
In this article, we provide detailed insights into CCI.
The Commodity Channel Index is used to determine whether the price movements of an asset are in line with the current trend. Investors can use the CCI to identify whether an asset is in overbought or oversold territory.
CCI is not only used in commodity markets but also in stocks, currency pairs, and other financial instruments. The indicator helps assess market momentum by measuring the difference between the asset’s price and its historical averages.
When the CCI value is positive, it means the asset’s price is above its historical average, and when it is negative, the price is below the historical average.
The CCI is based on the difference between an asset’s current price and the average price calculated over a specific period. The calculation steps are as follows:
The first step in calculating CCI is to find the typical price for each period. The typical price is obtained by averaging the high, low, and closing prices of the asset. The formula is as follows:
Next, the simple moving average of the typical prices over a specific period is calculated. This average serves as the reference point for the CCI calculation. Typically, a 20-period SMA is used, but traders can adjust this setting based on their preferred timeframes.
After calculating the SMA, the deviation of each period's typical price from this average is measured. The mean deviation is found by taking the average of the absolute values of these deviations. The total deviation is then divided by the number of periods.
In the final step, the CCI is calculated using the following formula:
The 0.015 constant is used to standardize the values of the indicator. The CCI value typically ranges between +100 and -100. Positive values indicate overbought conditions, while negative values suggest oversold conditions.
These steps allow traders to assess the momentum of an asset’s price movements and determine whether the market is in overbought or oversold territory.
The CCI helps determine if an asset's price aligns with the current trend and if the market is reaching extreme levels, indicating potential reversal points.
The indicator typically moves between +100 and -100 levels. If the CCI is above +100, it indicates that the asset has entered overbought territory and a potential pullback or correction may occur. Conversely, if the index falls below -100, the asset may be in oversold territory.
The Commodity Channel Index also provides insight into momentum. CCI values above zero indicate strong upward pressure on the asset. Similarly, when it falls below zero, it signals that downward pressure is dominant.
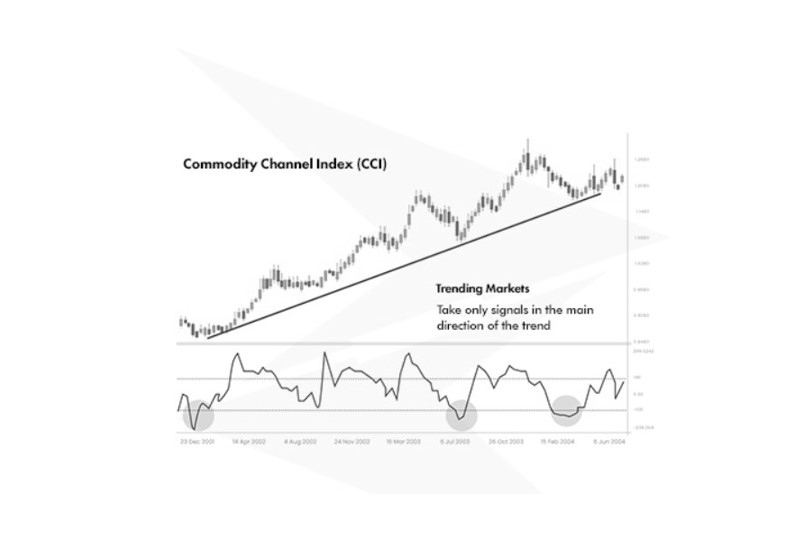
In the chart above, you can see the price movements and CCI values of an asset. The blue line represents the price movements, while the green line shows the CCI values. Let’s analyze this chart together:
CCI and the Stochastic Oscillator are both momentum indicators used to detect extreme market conditions. However, the two indicators operate using different methods.
CCI measures how much an asset's price deviates from its historical averages, while the Stochastic Oscillator analyzes the relationship between the asset's price and its highest and lowest levels over a set time period. The Stochastic Oscillator focuses on the position of the closing price within a specific time period.
Now, to better understand the key differences between CCI and the Stochastic Oscillator, let's take a look at the table below:
| Commodity Channel Index (CCI) | Stochastic Oscillator |
| Measures the asset's deviation from its historical average. | Compares the closing price to the range of high and low prices over a set period. |
| Evaluates the momentum of a trend and detects overbought/oversold conditions. | Identifies the position of the price relative to its recent high/low range, detecting overbought/oversold conditions. |
| Typically moves between +100 and -100. | Oscillates between 0 and 100. |
| Values above +100 indicate overbought, below -100 indicate oversold. | Values above 80 indicate overbought, below 20 indicate oversold. |
| Performs well in trending markets. | Works effectively in both trending and range-bound markets. |
The Commodity Channel Index (CCI) and the Relative Strength Index (RSI) are both popular momentum indicators that help investors identify extreme market conditions. They use different methodologies to signal potential continuation or reversal points, each offering unique benefits under various market scenarios.
While CCI measures how much an asset's price deviates from its historical averages, RSI evaluates how quickly and strongly the price is moving. Commodity Channel Index typically provides buy or sell signals at +100 and -100 levels, whereas RSI indicates conditions above 70 and oversold conditions below 30.
In the table below, you can more clearly see the differences between CCI and RSI:
| Commodity Channel Index (CCI) | Relative Strength Index (RSI) |
| Measures the asset's deviation from its historical average. | Evaluates the speed and magnitude of price changes over a set period. |
| Detects overbought/oversold conditions and evaluates trend momentum. | Identifies overbought/oversold conditions based on price momentum. |
| Typically moves between +100 and -100. | Oscillates between 0 and 100. |
| Values above +100 indicate overbought, below -100 indicate oversold. | Values above 70 indicate overbought, below 30 indicate oversold. |
| Performs well in trending markets. | Works effectively in volatile markets and for momentum analysis. |
In which markets does CCI perform best?
CCI generally performs best in trend-following markets. In markets with strong trends, such as commodities, stocks, and forex, the overbought and oversold signals can be effective. However, in sideways markets or during periods of high volatility, it may be less reliable.
How can I use CCI with other indicators?
CCI typically provides stronger signals when used alongside other indicators such as MACD, RSI, or moving averages. For example, if CCI is in the overbought region and RSI also indicates overbought conditions, it may be considered a stronger sell signal.
What are the overbought and oversold levels of CCI?
The overbought level for CCI is typically considered to be +100. When the indicator moves above this level, the asset is viewed as entering overbought territory, and a pullback may be likely. The oversold level is -100. When CCI falls below this level, the asset may signal a potential recovery.
What are the best settings for CCI?
The most commonly used settings for CCI are 14 or 20 periods. Shorter periods are often used for short-term trades, while longer periods may be preferred for long-term trades. In volatile markets, shorter periods can make the indicator more responsive.
How can I measure the strength of a trend with CCI?
CCI evaluates the strength of a trend by measuring the deviation of price movements from their average. When the indicator is above zero and approaching +100, the trend is considered strong. Conversely, when CCI falls below zero and approaches -100, it indicates that a downward trend is gaining strength.
What risks should I be aware of when using CCI?
CCI can produce false signals, especially in sideways markets or during periods of high volatility. As a result, relying on CCI alone can lead to incorrect buy or sell decisions. Since CCI is a trend-following indicator, it may provide delayed signals when market conditions change.
Sign up in seconds for free, access your platform, and start trading with ease.
 $200 Oil Scenario: The Chain Reaction Across Markets
What happens if oil hits $200? See the impact on global markets, sectors, inflation, and which industries could win or lose.
Detail Biggest Manipulations in Financial Market History
Financial markets have seen their share of manipulation over the years. Here are seven of the biggest cases in modern history.
Detail Petrodollar System: Why It Still Matters
Energy markets depend on supply routes, currency systems, and trade infrastructure determine prices, inflation, and financial stability across the global economy.
DetailThen Join Our Telegram Channel and Subscribe Our Trading Signals Newsletter for Free!
Join Us On Telegram!


