


Investors use various patterns in technical analysis to predict price movements, one of which is known as the Cup and Handle pattern. The pattern is particularly common in stock CFDs and commodities, serving as a valuable tool for understanding long-term trends. Traders frequently utilize this pattern to gain insights into market movements.
In this article, we will explore the fundamental dynamics of the Cup and Handle pattern and how it can serve as a guide for investors.
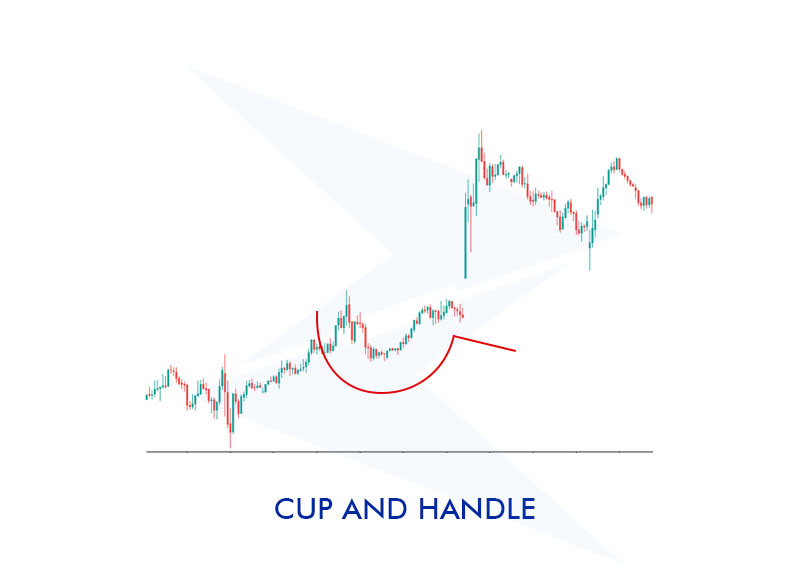
The Cup and Handle pattern forms when prices gradually decrease over time and then rise in a similar manner. It generally indicates a continuation of an upward trend.
The rounded bottom of the cup shows that prices have fallen for a while and then recovered, while the handle part represents a short-term consolidation period. The pattern is commonly used in the analysis of long-term trends and offers buying opportunities for traders.
To identify a Cup and Handle pattern, you can follow these steps:
The handle of the Cup and Odd Handle is slightly different from the standard formation. The handle usually moves within a wider or longer range. The extension of the handle is generally interpreted as a reduction in the validity of the formation.
The pattern forms over a very long time, usually lasting several years. Its slowly and steadily forming pattern can be a strong signal for long-term investment strategies. However, as it takes a long time to complete, it requires patience.
The intraday cup and handle formation is especially important for traders who engage in intraday trading. This quickly forming pattern can offer buying and selling opportunities within the same day.
The Cup and Handle pattern typically indicates the continuation of an upward trend. The pattern shows that after a period of decline and recovery, the price enters a short consolidation phase. It suggests that market participants are regaining interest in the asset, increasing buying pressure.
Upon the completion of the pattern, a breakout to the upside is expected. If accompanied by an increase in volume, the breakout can be seen as a strong buy signal.
The Cup and Handle pattern is particularly effective in long-term investment strategies. Traders can identify strategic entry points by observing the completion of the pattern and the next breakout.
The most common approach to using the Cup and Handle pattern is to look for opportunities to enter a long position. First, you can place a stop-buy order just above the upper trend line of the handle. This allows you to automatically take a position if the price breaks out. However, with such an aggressive entry, there is a risk of experiencing a false breakout and slippage.
If you prefer a more cautious approach, you can wait for the price to close above the handle’s trend line. After this close, you can place a limit order slightly below the breakout level, attempting to take a position if the price pulls back. This way, you can protect yourself from false breakouts, but there is also the risk of missing the trade if the price continues to rise without pulling back.
Let's examine the Cup and Handle pattern through an example:
For instance, let's say the price of a stock CFD drops from $50 to $40. Then, as the price gradually rises back to $50, the cup shape forms. At this point, the price moves within a narrow range between $48 and $50 for a while, and this range forms the handle.
If the price breaks above the $50 level, it means the Cup and Handle pattern is complete and is considered a strong signal that the uptrend will continue.
The target price can be set as a rise equal to the depth of the cup. For example, if the cup's depth is $10 (from $40 to $50), the target price can be set at $60.
We can observe this pattern in the following chart:
What does a Cup and Handle pattern indicate?
The Cup and Handle pattern generally indicates a continuation of a bullish trend. It suggests that after a period of decline, prices have recovered, followed by a brief consolidation phase.
What happens after a Cup and Handle pattern forms?
Once the Cup and Handle pattern is completed, an upward price breakout is expected. This breakout is typically supported by an increase in volume, signaling a continuation of the upward trend.
Is the Cup and Handle pattern bullish?
Yes, the Cup and Handle pattern is generally considered a bullish pattern that signals a continuation of the upward trend. The initial decline followed by a recovery indicates a bullish market sentiment.
What is the cup with no handle pattern?
The cup with no handle pattern forms when prices reach the top of the cup and break out upwards without entering a consolidation phase. Without the handle, the price movement may be quicker and more aggressive.
When should you use the Cup and Handle pattern for trading?
The Cup and Handle pattern is useful for long-term trading strategies. It is ideal to enter a position after the pattern is complete and the price breaks out upwards.
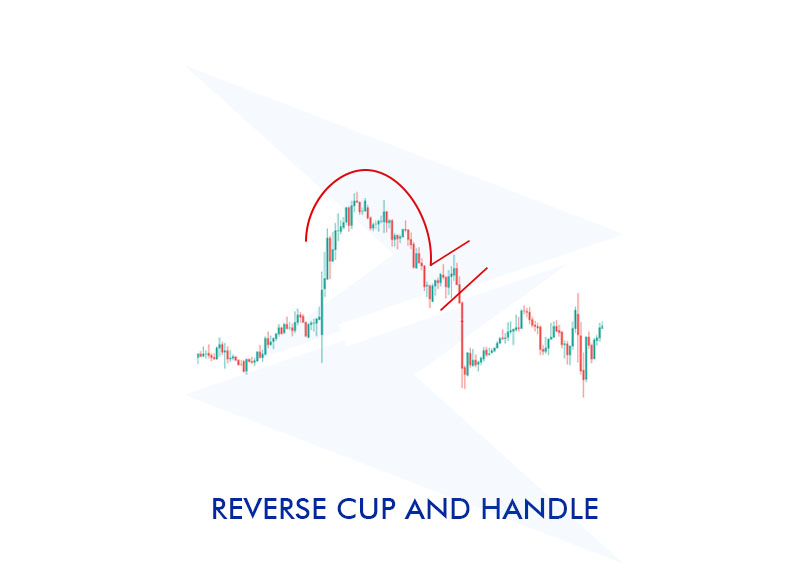
What Is the reversal downtrend for the Cup and Handle pattern?
In the Cup and Handle pattern, the bottom of the cup usually reflects a downtrend. This downtrend ends as prices recover, forming the rounded part of the cup. A short consolidation phase follows, forming the handle, and the pattern is completed when the price breaks out upward.
Sign up in seconds for free, access your platform, and start trading with ease.
 $200 Oil Scenario: The Chain Reaction Across Markets
What happens if oil hits $200? See the impact on global markets, sectors, inflation, and which industries could win or lose.
Detail Biggest Manipulations in Financial Market History
Financial markets have seen their share of manipulation over the years. Here are seven of the biggest cases in modern history.
Detail Petrodollar System: Why It Still Matters
Energy markets depend on supply routes, currency systems, and trade infrastructure determine prices, inflation, and financial stability across the global economy.
DetailThen Join Our Telegram Channel and Subscribe Our Trading Signals Newsletter for Free!
Join Us On Telegram!


