


Fibonacci (Fib) is a tool widely used in trading to predict potential price movements and identify key levels of support and resistance. Named after the Italian mathematician Leonardo Fibonacci, this method is based on a sequence of numbers where each number is the sum of the two preceding ones.
Fibonacci levels (Fib levels) help traders make better decisions by highlighting areas where the price is likely to retrace or extend.
Understanding and using Fibonacci retracement (Fib retracement) and extension levels may improve a trader's technique in many ways. These levels provide a framework for anticipating market reversals and setting profit targets, which makes them invaluable for all kinds of traders.
Fib analysis can be used in trading strategies and increase the ability to handle market volatility and maximize entry and exit locations.
Fibonacci retracement helps traders identify strategic entry and exit points, aligning with the natural ebb and flow of market movements. Fibonacci levels are used to identify levels of support and resistance that are predicted by Fibonacci retracement levels, as shown below:
Applying retracements in trading involves a few simple steps that can help traders identify potential levels of support and resistance where the price might reverse. Here's a step-by-step guide:
Let's take a look in more detail:
First, determine the overall direction of the market. This involves identifying whether the market is in an uptrend or a downtrend. An uptrend is characterized by higher highs and higher lows, while a downtrend features lower highs and lower lows.
Recognizing the trend is very important because it guides you in selecting the points for drawing the retracement levels.
In an uptrend, identify the most recent significant low point (swing low) and the highest point reached before a pullback (swing high). In a downtrend, choose the most recent significant high point (swing high) and the lowest point reached before a bounce (swing low). These points form the basis for your retracement analysis.
Using a charting tool, draw the retracement levels from the swing low to the swing high in an uptrend, or from the swing high to the swing low in a downtrend. Most trading platforms have built-in tools for this purpose.
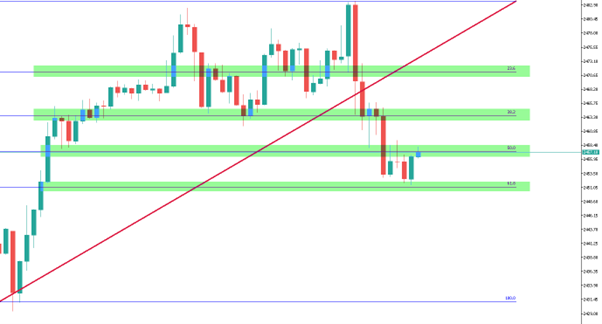
These levels (23.6%, 38.2%, 50%, 61.8%, and 78.6%) will automatically appear on the chart, indicating potential areas where the price may retrace before continuing in the original direction.
Examine the retracement levels to identify potential support or resistance zones. These levels are areas where the price is likely to stall, reverse, or consolidate.
Traders use these levels to set entry points, stop-loss orders, and profit targets. Confirm these levels with other technical indicators or price action signals to increase the reliability of your analysis.
Use the retracement levels in your trading strategy. For instance, if the price retraces to a 61.8% level in an uptrend and shows signs of reversing back up, it might be a good entry point.
Place stop-loss orders below the swing low to manage risk and set profit targets at higher Fib extension levels or recent highs.
The Moving Average Convergence Divergence (MACD) indicator is a popular tool that helps identify changes in the strength, direction, momentum, and duration of a trend.
When combined with retracement levels, the MACD can provide confirmation for potential reversal points. For example, if the price retraces to a key level and the MACD shows a bullish crossover, it could signal a strong buying opportunity.
The Stochastic Oscillator is another useful tool that measures the current price relative to its price range over a specific period.
Combining it with retracement levels can enhance your trading decisions. If the price hits a key retracement level and the Stochastic indicates an overbought or oversold condition, it might confirm a potential reversal, making it a strategic point to enter or exit a trade.
Applying retracement levels on longer timeframes, such as daily or weekly charts, can provide more reliable support and resistance levels.
Longer timeframes tend to filter out market noise and give a clearer picture of the overall trend. This approach is particularly useful for swing traders and position traders who aim to capture larger market moves.
Extensions are used to forecast potential areas where the price might move following a retracement. These levels help traders set profit targets by providing a framework for projecting the extent of a price move beyond the original trend.
Fib extension levels are calculated beyond the standard retracement levels and include 127.2%, 161.8%, 200%, and 261.8%.
Applying extensions has four main steps to follow:
Imagine you are trading a stock in an uptrend. The stock reaches a high of $100 (swing high) and then retraces to $90 (swing low). After identifying these points, you draw the Fib extension levels, which project potential targets at $107.20 (127.2%), $116.80 (161.8%), and $130.00 (200%). As the stock price resumes its uptrend, these levels serve as potential profit targets.
Like all strategies in trading, using Fibonacci has its ups and downs. Advantages include identification of key levels, versatility, improved risk management, and combining well with other indicators.
However, the limitations include subjectivity, not being a standalone tool, market noise, and the need to practice a lot.
Here's a more detailed look at the advantages and limitations:
Fibonacci retracement and extension levels are powerful tools that can enhance a trader's ability to identify potential support and resistance areas, set profit targets, and manage risk effectively. By integrating Fibonacci with other technical indicators such as the MACD and Stochastic Oscillator, traders can improve the reliability of their trading signals and make more informed decisions.
While Fib levels offer significant advantages, including their versatility and ability to improve risk management, they also come with limitations. These include their subjective nature and the need for practice and experience to use them effectively.
Traders should use Fib levels as part of a comprehensive trading strategy, combining them with other tools and market analysis to optimize their approach.
Is Fibonacci effective in trading?
Yes, it is effective in identifying potential support and resistance areas, helping traders make more informed decisions.
What are the best Fibonacci numbers for trading?
The most commonly used levels in trading are 23.6%, 38.2%, 50%, 61.8%, and 78.6%.
How do you use Fibonacci in TradingView?
In TradingView, use the Fibonacci retracement tool by selecting it from the toolbar, then click and drag from the swing high to the swing low (or vice versa) to plot the levels.
What is the best timeframe to use Fibonacci?
Fib levels can be used on various timeframes, but longer timeframes like daily or weekly charts often provide more reliable signals.
How do traders use the Fibonacci sequence?
Traders use the Fib sequence to identify retracement and extension levels, which help predict potential price movements and set entry and exit points.
What is the golden rule of Fibonacci retracement?
The golden rule is the 61.8% retracement level, often considered a key level where the price tends to reverse or consolidate.
Sign up in seconds for free, access your platform, and start trading with ease.
 $200 Oil Scenario: The Chain Reaction Across Markets
What happens if oil hits $200? See the impact on global markets, sectors, inflation, and which industries could win or lose.
Detail Biggest Manipulations in Financial Market History
Financial markets have seen their share of manipulation over the years. Here are seven of the biggest cases in modern history.
Detail Petrodollar System: Why It Still Matters
Energy markets depend on supply routes, currency systems, and trade infrastructure determine prices, inflation, and financial stability across the global economy.
DetailThen Join Our Telegram Channel and Subscribe Our Trading Signals Newsletter for Free!
Join Us On Telegram!


