



Breakouts might look simple on a chart. They occur when the price pushes above resistance or drops below support. It may feel like the next big move has already started. However, in real trading, not every break is worth following. Some moves continue strongly, while others quickly snap back and trap early traders. That is why confirmation matters.
Before entering a breakout trade, check one thing first. Is the market really moving into a new price area, or is it only making a quick fake move?
A breakout happens when price moves beyond an important level on the chart. This level can be resistance, support, a trendline, or the edge of a chart pattern. For example, if EUR/USD keeps failing near 1.15 and then finally moves above it, traders may see it as a bullish signal.
The move can happen in both directions. A push above resistance shows buying strength. A drop below support shows selling pressure. The idea is simple: price is trying to leave its old range and move into a new area.
False moves usually happen around obvious levels. Many traders place their entries and stop-losses near the same support or resistance zones. Price can briefly move beyond that level, trigger those orders, and then return into the range.
They can also happen when market activity is weak. A price break during a quiet session may not have enough buyers or sellers behind it. News spikes can do the same thing. Price jumps fast, but the move does not last.
A false move can look exciting at first. Price breaks the level, and traders may think a new trend is starting. But if you check it carefully, the warning signs can be spotted.
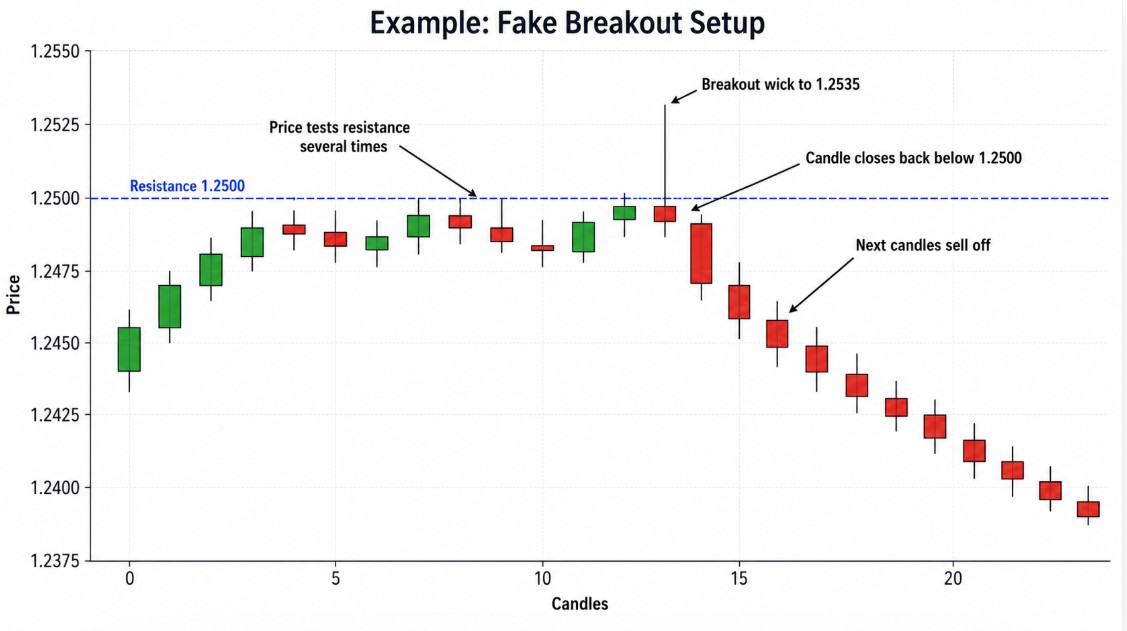
A fake breakout is easier to understand when you follow the candles step by step. The key point is not the wick. The key point is where the candle closes.
Let’s say GBP/USD has resistance at 1.2500. Price tests this level several times but cannot close above it. Then one candle suddenly spikes to 1.2535. This looks like a bullish breakout, at first.
But the candle does not hold above resistance. It closes back below 1.2500, around 1.2491. This is the first warning sign. The market tested the breakout area but rejected it.
After that, the next candles start moving lower. Price falls to 1.2470, then 1.2458, and later toward 1.2390. Buyers failed to defend the breakout. That is why this setup looks more like a fake breakout than a real one.
In this example, the fake breakout signs are clear:
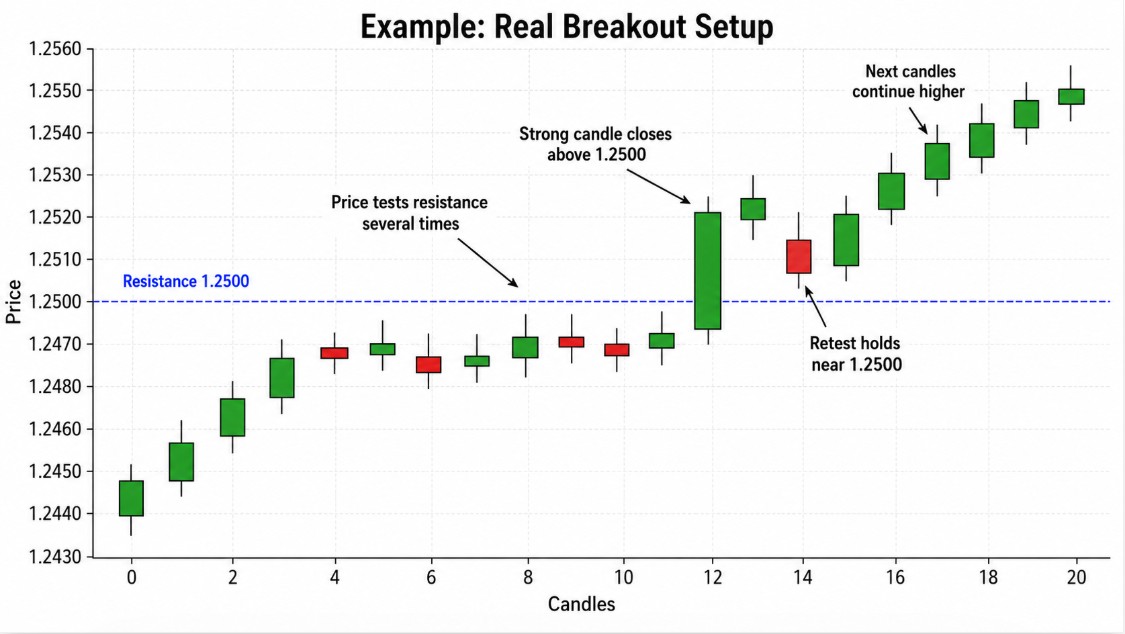
A real breakout becomes easier to spot when price does more than just cross a level. It needs to close beyond that level and then show follow-through.
Let’s say GBP/USD has resistance at 1.2500. Price tests this area several times but stays below it. Then a strong bullish candle breaks above resistance and closes around 1.2518. This is the first positive sign. The market is not only touching the level. It is closing above it.
After the breakout, price moves a bit higher and then pulls back near 1.2500. This is the retest. Instead of falling to where it came from, the price holds its ground and buyers step back in. Price stays above 1.2500 and starts climbing toward 1.2530, 1.2540, and then 1.2550.
This setup looks stronger because the breakout had confirmation. The candle closed above resistance, the retest held, and the next candles continued in the same direction.
In this example, the real breakout signs are clear:
There is no single signal that confirms every breakout. The goal is to collect enough clues before entering. A good breakout shows clear closure, strong price action, market activity, and follow-through. A weak one looks rushed and fails quickly.
This is the first rule. Do not enter only because price moves above resistance or below support for a few seconds. The candle may still reverse before it closes. That is how many fake breakouts trap early traders.
For a bullish breakout, wait for a candle that is close above resistance. For a bearish breakout, wait for a candle to close below support. A clean close shows that price has spent enough time beyond the level. It gives the move more weight.
A strong breakout candle usually has a clear body. For a bullish breakout, the candle should close near its high. For a bearish breakout, it should close near its low.
Be careful with long wicks. A candle may break the level for a moment, then close back near the same area. That shows rejection, not strength.
A breakout is stronger when more traders support the move. In stocks, futures, and crypto, volume can help you see that. Higher volume means the move has more participation.
In forex and CFDs, volume is different. Many platforms show tick volume, not full market volume. It can still help, but use it as a supporting clue only.
A retest gives the breakout another test. Price breaks the level, then comes back to it. If the level holds, the breakout looks stronger.
For example, broken resistance may turn into support. If buyers defend that area, the move has a better chance of continuing.
A breakout on a small timeframe can look strong. But the higher timeframe may tell a different story. Price could be breaking out on the 15-minute chart while hitting major resistance on the 4-hour chart.
Use the higher timeframe first. Check the main trend and key levels. Then use your trading timeframe to plan the entry.
Do not look at the breakout alone. Ask what is happening around it. Is the market trending or ranging? Is there a major news event soon? Is the move happening during an active session?
A breakout during London or New York hours may carry more weight in forex. A breakout during quiet market hours can fail more easily.
Indicators can help, but they should not replace price action. Indicators can help you but you shouldn’t replace them with the price action. RSI, MACD, moving averages, and ATR can give extra context.
For example, rising momentum can support a bullish breakout. A moving average can show if price is moving with the trend. Yet, using too many indicators can make the setup harder to read.
Fake breakouts are part of trading. You cannot avoid all of them, and you do not need to. But you should stop reacting to every move on the chart.
Wait for confirmation. Check the candle close, retest, volume, market context, and higher timeframe. Have your entry, stop-loss, and exit plan ready before the trade starts.
A planned trader is less likely to panic when the market pulls back. A prepared trader also knows when the setup is no longer valid. This is the psychological side of successful breakout trading.
Sign up in seconds for free, access your platform, and start trading with ease.

 How Index Futures Influence the Stock Market Open
How do index futures influence the stock market open? Learn what pre-market moves reveal about opening prices, market sentiment, and trader psychology.
Detail What Is the Nasdaq?
What is the Nasdaq? Learn how the Nasdaq Composite Index works, which stocks it includes, and what influences its performance.
Detail What Is the FTSE 100?
The FTSE 100 tracks the largest companies listed on the London Stock Exchange. Explore how it is calculated and what influences its performance.
DetailThen Join Our Telegram Channel and Subscribe Our Trading Signals Newsletter for Free!
Join Us On Telegram!


