


Developing trading strategies in financial markets requires traders to constantly seek new tools and methods. Trend-following strategies, in particular, play a major role in capturing opportunities that arise in the market. One of the tools used for this purpose is the Parabolic SAR indicator.
In this article, you will find detailed information about the Parabolic SAR.
The Parabolic SAR (Stop and Reverse) is an indicator used to determine the trend direction and identify potential reversal points by analyzing the price movements of an asset. It helps traders understand whether the current trend is likely to continue or if there is a high probability of a reversal in the market.
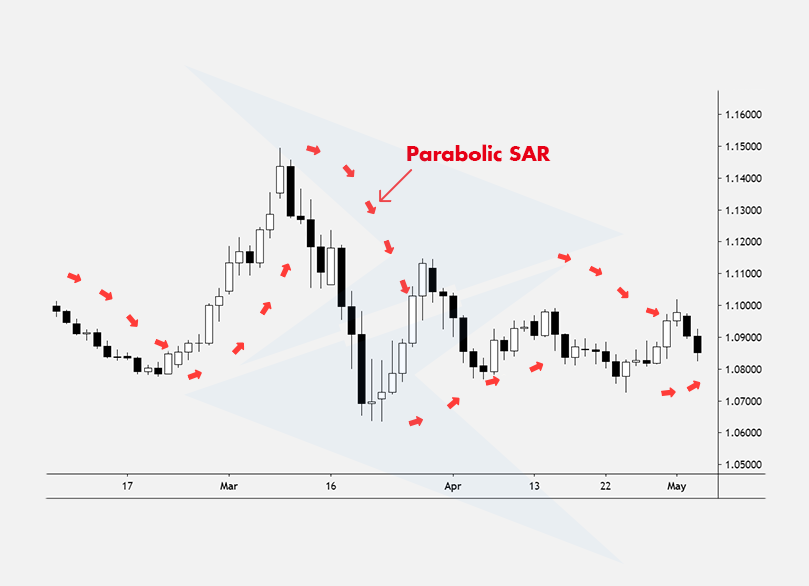
The indicator is displayed on a chart as dots positioned above or below the price. These dots indicate whether the asset is in an uptrend or a downtrend. If the dots are below the price, it signals an uptrend, while if the dots are above the price, it indicates a downtrend.
One of the main advantages of the Parabolic Stop and Reverse is that it can provide early signals of a trend change to traders. However, the indicator performs best during strong trends. In sideways or highly volatile markets, it may be less reliable.
PSAR is calculated using a specific formula for each period based on price movements, and this formula generates dots on the chart. The calculation process differs depending on the direction of the trend.
Below are the steps followed in the calculation of the Parabolic SAR:
When price movements cross above or below the SAR, the trend is considered to have reversed, and the calculation direction changes. At this point, the new SAR value is recalculated based on the highest or lowest price of the new trend, and the acceleration factor resets to 0.02.
The basic formula used in the calculation of the Parabolic SAR is as follows:
The components of this formula can be explained as follows:
The Parabolic SAR indicator is used to determine whether an asset is in an uptrend or downtrend and also provides signals about when that trend might end. It is particularly useful for trend-following traders.
In an uptrend, SAR points are positioned below the price, indicating that the trend is continuing. However, when the price drops below the SAR points, this suggests that the trend might be reversing, generating a sell signal. Similarly, in a downtrend, SAR points remain above the price, and when the price moves above the SAR, it generates a buy signal.
The indicator guides traders on whether to close or open a new position. Parabolic SAR signals are particularly important for deciding whether to maintain or close an existing position.
In an uptrend, if the SAR points move below the price, it might be wise to close the position. Similarly, in a downtrend, when the SAR points move above the price, it serves as a warning to close the position.
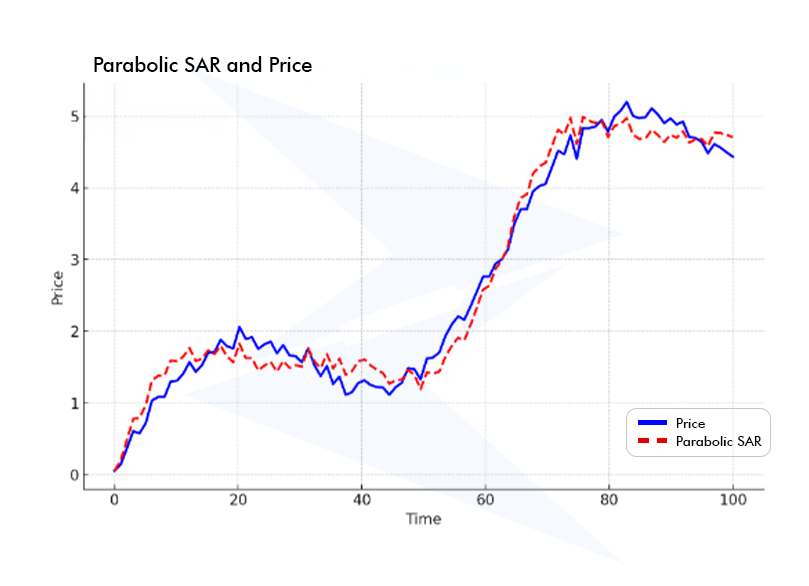
In the chart above, you can observe how the price movements of an asset appear alongside the Parabolic SAR points. The blue line represents the price movements, while the red dashed line represents the Parabolic SAR points:
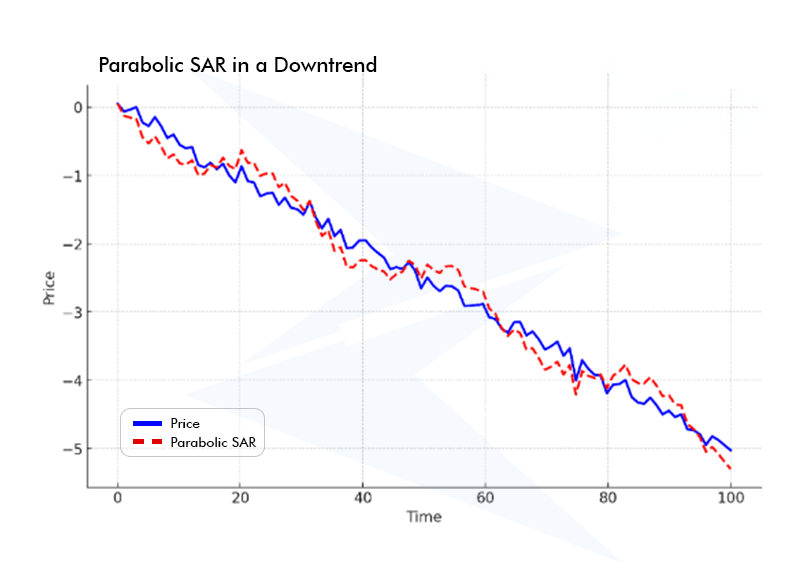
In the chart above, we see an example of the PSAR for an asset in a downtrend:
The most important parameter of the indicator is the acceleration factor (AF). This factor determines how quickly the indicator responds to price movements. By default, the acceleration factor of the Parabolic SAR starts at 0.02, and for each new high or low price level, it increases by 0.02, but it is typically capped at 0.2.
The acceleration factor can be adjusted according to traders' strategies. In faster-moving markets, increasing the acceleration factor makes the indicator more sensitive. This allows for quicker signals, but it also increases the risk of false signals.
In slower markets, lowering the acceleration factor results in fewer signals, but those signals tend to be more reliable.
The default settings of the Parabolic SAR are generally suitable for trend-following strategies, but since each trader has different risk tolerance and approaches, optimizing these settings is important.
The Parabolic SAR indicator is frequently used in trend-following strategies and provides traders with signals on whether the trend will continue or when it might reverse. Therefore, using the PSAR correctly can help traders make strategic buy and sell decisions.
When trading with a Parabolic SAR strategy, the basic rule is to monitor when the price crosses above or below the SAR points. In an uptrend, SAR points remain below the price, signaling a buy opportunity.
However, when the price falls below the SAR points, it is considered a sell signal. Similarly, in a downtrend, SAR points are positioned above the price, and when the price breaks above these points, it signals a buy opportunity.
One important factor to consider when trading with this strategy is market conditions. The Parabolic SAR performs best in strong trends. However, in sideways or highly volatile markets, it may provide misleading signals. In such cases, it is key to confirm signals with some other insights.
For instance, the accuracy of buy and sell signals can be validated with indicators like MACD, RSI, or moving averages.
In a Parabolic SAR strategy, position sizing and risk management should also be considered. Especially in volatile markets, stop and reverse points can change rapidly. So, it’s recommended to add a stop-loss level to your position.
Parabolic SAR is primarily used to identify the direction of the trend and potential reversal points. It provides signals on whether the trend will continue by displaying points above or below the price during the trend.
On the other hand, the Moving Average is based on the asset's past performance and calculates an average to determine the overall direction of the trend. The MA generates buy or sell signals when the price crosses above or below the moving average.
Additionally, Parabolic SAR typically provides faster signals and is better suited for short-term trades. It is effective in predicting when the trend may end.
Meanwhile, the Moving Average offers more stable signals, particularly in longer-term trades, but it can provide delayed signals in the short term.
Below, you can see the table that highlights the differences between PSAR and MA more clearly:
| Parabolic SAR | Moving Average (MA) |
| Identifies trend direction and potential reversal points. | Determines the general direction of the trend by averaging past prices. |
| Provides faster signals, better suited for short-term trades. | Provides slower, more stable signals, often better for long-term trades. |
| Performs best in strong trending markets. | Effective in both trending and sideways markets. |
| Useful for quickly identifying trend changes and managing positions. | Smooths out price fluctuations, ideal for long-term trend following. |
What is the best setting for Parabolic SAR?
The best setting for the Parabolic SAR depends on the trading strategy and market conditions. The default acceleration factor (AF) is 0.02 and typically increases up to 0.2. To receive faster signals, the acceleration factor can be increased, but this also increases the risk of false insights.
For more reliable signals, the acceleration factor better be kept lower.
What do Parabolic SAR dots indicate?
Parabolic SAR dots indicate the direction of the trend and potential trend reversals. When the dots are below the price, it signals an uptrend, and when they are above the price, it indicates a downtrend. If the price crosses above or below the SAR dots, it is considered a signal that the trend has ended and a reversal may be likely.
How is Parabolic SAR used with other indicators?
Parabolic SAR often provides stronger signals when used alongside other indicators. Using it with MACD, RSI, and Moving Averages can increase the accuracy of signals. For example, MACD or RSI’s overbought or oversold signals can be used to confirm a trend reversal signaled by the Parabolic SAR.
How does Parabolic SAR respond to volatility?
Parabolic SAR works well in strong trending markets but can provide misleading signals in highly volatile markets. In markets where prices frequently change direction, SAR dots can shift quickly. That’s why SAR signals should be used cautiously in volatile markets.
What indicators should be used with PSAR?
Parabolic SAR is typically used alongside trend confirmation and momentum indicators. MACD, RSI, and Moving Averages are effective tools to confirm PSAR signals and make more reliable trading decisions. These indicators can validate PSAR's trend reversal signals and help traders make strategic choices.
Sign up in seconds for free, access your platform, and start trading with ease.
 $200 Oil Scenario: The Chain Reaction Across Markets
What happens if oil hits $200? See the impact on global markets, sectors, inflation, and which industries could win or lose.
Detail Biggest Manipulations in Financial Market History
Financial markets have seen their share of manipulation over the years. Here are seven of the biggest cases in modern history.
Detail Petrodollar System: Why It Still Matters
Energy markets depend on supply routes, currency systems, and trade infrastructure determine prices, inflation, and financial stability across the global economy.
DetailThen Join Our Telegram Channel and Subscribe Our Trading Signals Newsletter for Free!
Join Us On Telegram!


