


Triple Top and Triple Bottom formations are important chart patterns used in technical analysis. Both patterns provide signals that the market is struggling to move in a certain direction and that a trend reversal may be imminent.
These patterns reflect repeated price movements at certain levels. After these levels are broken, a strong new move in the market is expected.
You can explore our article to learn more about Triple Top and Triple Bottom patterns.
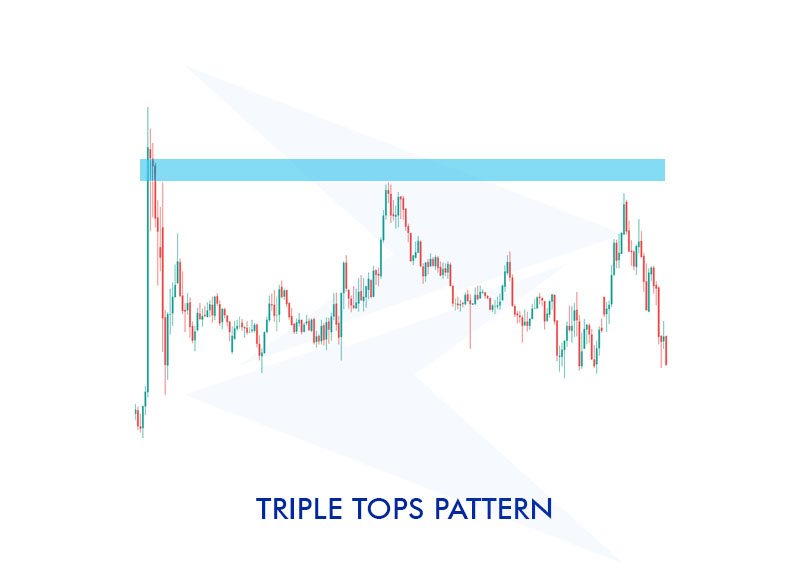
The Triple Top pattern is a technical analysis model that indicates the potential end of an uptrend when prices reach the same level three times without surpassing it, followed by a pullback. The pattern is often considered a strong signal that a downtrend may begin.
During the formation of this pattern, prices rise to a peak and then pull back. They rise again to a similar level, forming a second and third peak, but fail to exceed the first peak each time. The pattern is completed when prices break below the lowest level between the three peaks.
The Triple Top formation is a chart pattern where the price of an asset reaches nearly the same level three times and then shows a bearish trend. This formation indicates a resistance level that the asset's price encounters when it reaches the peak points. When the price falls below the swing low levels after the third peak, the formation is considered complete, and the price is expected to continue declining.
Let's understand this with an example using the XAU/USD pair. Assume that the gold price initially rises to $1980 and then falls back to $1920. Later, the price rises again to $1975 and then drops to $1925. Finally, assume the price rises to $1970 for the third time and then returns to the $1925 level.
In this scenario, the gold price approaches the $1970-$1980 level three times, then pulls back, and after the third peak, it falls below the $1925 level, completing the Triple Top formation. This situation signals that the price may continue to decline.
We can observe a similar situation in the chart below:
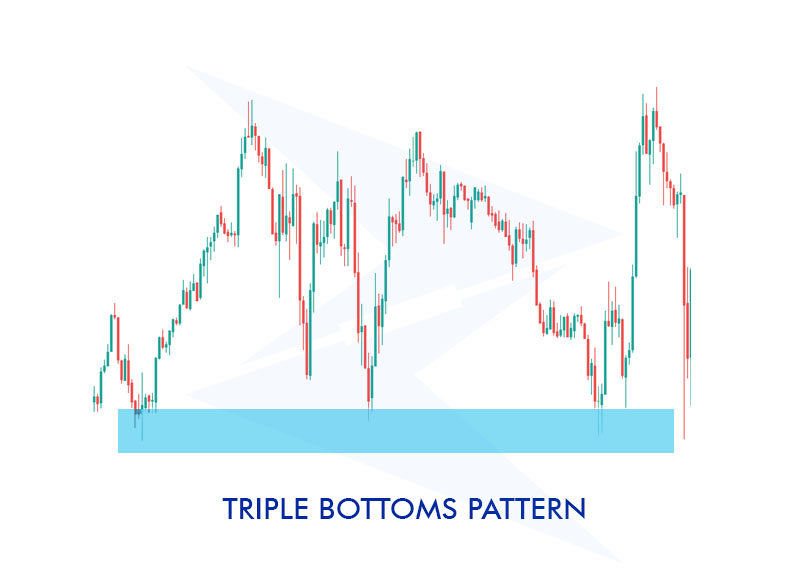
A triple bottom pattern is a type of chart formation in which an asset's price falls to almost the same level three times before showing signs of a positive trend. This pattern suggests that the asset has a support level and that the market is likely to rebound from it if the price is unable to break through it.
The formation has been considered complete and further price increases are anticipated if the price begins to rise following the third bottom. Usually, this formation denotes the end of a downward trend and shows that buyers are becoming more powerful in the market.
The Triple Bottom pattern is a chart formation where the price of an asset drops to a specific support level three times, recovers each time, and then enters a bullish trend.
To better understand this, let's consider an example using the EUR/USD pair. Assume that during the first bottom, the pair falls to the 1.0800 level and then recovers to 1.0900. In the second bottom, the same low level is tested again, but this time the recovery occurs at 1.0875. In the third bottom, the price drops to 1.0800 and then rises to 1.0880.
In this scenario, the EUR/USD pair has dropped to the 1.0800 support level three times, recovering each time. The price starting to rise after the third bottom indicates that the Triple Bottom pattern has been completed, suggesting that the price may rise further.
You can observe a similar scenario in the chart below:
|
Criteria |
Triple Top Formation |
Triple Bottom Formation |
|---|---|---|
| Price Movement | Price reaches a resistance level three times, forming three peaks. | Price drops to a support level three times, forming three troughs. |
| Resistance/Support Levels | Peaks form at roughly the same resistance level. | Troughs form at roughly the same support level. |
| Intermediate Retracements | After each peak, the price pulls back but doesn't break the support level. | After each trough, the price rebounds but doesn't break the resistance level. |
| Volume Behavior | Volume may decrease on the approach to the third peak. | Volume may decrease on the approach to the third trough. |
| Confirmation Signal | The formation is confirmed when the price breaks below the support level after the third peak. | The formation is confirmed when the price breaks above the resistance level after the third trough. |
| Trend Reversal | Typically signals the end of an uptrend and the beginning of a downtrend. | Typically signals the end of a downtrend and the beginning of an uptrend. |
What is the difference between a triple top & bottom and double top & bottom?
Triple Top and Triple Bottom formations are patterns where the price touches a certain level three times before pulling back. In Double Top and Double Bottom formations, the price only touches this level twice. Triple Top and Triple Bottom formations are generally considered more reliable because they involve more tested levels, but they take longer to form.
Are triple tops & bottoms rare?
Triple Top and Triple Bottom formations are rarer compared to Double Top and Double Bottom formations. This is because it's less common for the price to test a specific support or resistance level three times. However, when these formations do appear, they typically provide stronger trend reversal signals.
What are the differences between Triple Top and Triple Bottom formations?
The Triple Top formation occurs when the price reaches a certain resistance level three times and pulls back each time. This formation usually indicates the end of an uptrend and the potential start of a downtrend. The Triple Bottom formation, on the other hand, happens when the price falls to a certain support level three times and recovers each time. This formation signals the end of a downtrend and the beginning of an uptrend.
How is a Triple Top formation identified?
To identify a Triple Top formation, you should observe the price reaching a specific resistance level three times and pulling back each time. Each peak should be at roughly the same level. The formation is completed when the price falls below the previous low after the third peak.
How is a Triple Bottom formation identified?
To identify a Triple Bottom formation, you should observe the price dropping to a specific support level three times and recovering each time. Each trough should be at roughly the same level. The formation is completed when the price starts to rise after the third trough.
Are Triple Top & Bottom formations reliable?
Triple Top and Triple Bottom formations provide reliable trend reversal signals. These formations show that the price has tested a certain level three times without breaking it, which indicates that the market might change direction. However, as with any technical analysis tool, these formations can occasionally give false signals; therefore, it's recommended to use them in conjunction with other analysis tools.
How does the Triple Top formation compare with other trend reversal formations?
The Triple Top formation is similar to the head and shoulders pattern, but the middle peak is not higher than the other peaks. The Triple Top usually indicates a stronger resistance level because the price tests this level three times without breaking it. It can provide a stronger trend reversal signal than the head and shoulders formation.
How does the Triple Bottom formation compare with other trend reversal formations?
The Triple Bottom formation is similar to the Double Bottom formation, but the price tests the support level three times. This indicates a stronger support level and, therefore, can provide a stronger signal of a trend reversal. The Triple Bottom formation is considered a very reliable bullish signal, especially when it appears after a significant downtrend.
Sign up in seconds for free, access your platform, and start trading with ease.
 $200 Oil Scenario: The Chain Reaction Across Markets
What happens if oil hits $200? See the impact on global markets, sectors, inflation, and which industries could win or lose.
Detail Biggest Manipulations in Financial Market History
Financial markets have seen their share of manipulation over the years. Here are seven of the biggest cases in modern history.
Detail Petrodollar System: Why It Still Matters
Energy markets depend on supply routes, currency systems, and trade infrastructure determine prices, inflation, and financial stability across the global economy.
DetailThen Join Our Telegram Channel and Subscribe Our Trading Signals Newsletter for Free!
Join Us On Telegram!


