


Bollinger Bands are a popular technical analysis tool used by traders to identify potential price movements and volatility in the financial markets.
Created by John Bollinger in the 1980s, these bands consist of three lines: a simple moving average (SMA) in the middle, and two standard deviation lines above and below it. The distance between the upper and lower bands expands and contracts based on market volatility.
John Bollinger is a renowned financial analyst. He developed Bollinger Bands in the 1980s as a way to measure market volatility and identify potential trading opportunities.
Bollinger is the founder and president of Bollinger Capital Management, an investment management company that provides services to individuals, corporations, trusts, and retirement plans. Through his firm, he has helped clients navigate the complexities of trading, offering tailored investment strategies and portfolio management services.
In addition to his work at Bollinger Capital Management, John Bollinger is a prolific author and educator. He has written extensively on technical analysis, and his book "Bollinger on Bollinger Bands" is considered a definitive guide on the subject.
Bollinger was a sought-after speaker at industry conferences and he also contributed to various financial publications.
Bollinger Bands are a useful tool in technical analysis, providing traders with insights into price volatility and trends.
The primary purpose of Bollinger Bands is to help traders determine whether an asset is overbought or oversold. When the price of an asset moves close to the upper band, it is generally considered overbought. Conversely, when the price nears the lower band, it is seen as oversold, indicating a potential buying opportunity.
In addition to identifying overbought and oversold conditions, they are also used to gauge volatility. When the bands are wide apart, it refers to high volatility, whereas narrow bands indicate low volatility.
One of the key applications of Bollinger Bands in technical analysis is identifying breakouts. For instance, a breakout above the upper band may indicate the start of a bullish trend, while a breakout below the lower band may signal the beginning of a bearish trend.
In addition to breakouts, bands are also used to detect price squeezes, where the bands narrow, indicating reduced volatility. A price squeeze often precedes a period of increased volatility.
Before diving into how to effectively use Bollinger Bands, it's important to understand a key point: when the price touches the upper band, it doesn't automatically signal a sell, and when it touches the lower band, it doesn't necessarily indicate a buy. John Bollinger himself emphasized this by stating, "There is absolutely nothing about a tag of a band that in and of itself is a signal."
During strong trends, prices can "walk the band," meaning they repeatedly touch or break through the upper or lower bands. This phenomenon occurs during both uptrends and downtrends, indicating sustained momentum.
Therefore, instead of taking immediate action when the price hits a band, it might be wiser to look for specific chart patterns such as the "double bottom," "classic M top," or "three pushes to high" formation. These patterns can provide more reliable signals for potential reversals or continuations.
Let's delve deeper into these chart patterns:
A double bottom is a bullish reversal chart pattern that indicates a potential change in trend direction from down to up. This pattern forms after a sustained downtrend and is characterized by two distinct lows at approximately the same price level, with a moderate peak between them.
The double bottom pattern resembles the letter "W," and its appearance suggests that selling pressure is decreasing, and buying interest is increasing.
To identify a double bottom, traders look for the following features:
The Classic M Top is a bearish reversal chart pattern that indicates a potential change in trend direction from up to down. This pattern emerges following a prolonged uptrend and is marked by two separate peaks at nearly identical price levels, with a shallow dip or trough occurring between them.
The key features of a Classic M Top are as follows:
The "Three Pushes to High" is a bearish reversal chart pattern signaling a potential shift from an upward to a downward trend. This pattern develops after a prolonged uptrend and features three successive peaks, each higher than the last, with each peak followed by a moderate pullback.
To identify a "Three Pushes to High" pattern, traders look for the following features:
Bollinger Bands are constructed using two standard deviations, which are rooted in the statistical properties of the normal distribution and the concept of volatility. Standard deviation measures how far prices typically deviate from the Simple Moving Average (SMA), which is the middle band.
By setting the upper and lower bands two standard deviations away from the SMA, Bollinger Bands create a range expected to contain approximately 95% of the security's price movements over a given period.
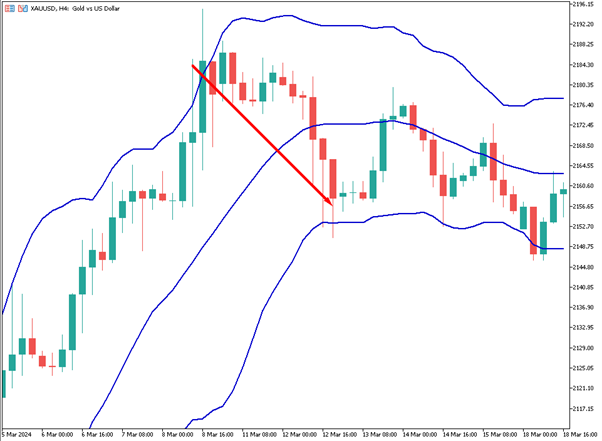
When the price touches or moves above the upper band, it often indicates that the asset is experiencing strong bullish momentum. However, this doesn't necessarily mean it's time to sell. Instead, traders should carefully analyze additional factors and patterns to make informed decisions.
When the price consistently touches or exceeds the upper band, it suggests sustained upward momentum. This could be a signal to hold onto long positions and possibly add to them, provided that other indicators confirm the bullish trend.
Another important aspect to consider is the volume accompanying the price movements. A price touching the upper band with high volume can indicate a robust trend, whereas a touch with declining volume may signal weakening momentum.
Consistent contact with the lower band indicates sustained bearish momentum. If this happens, traders might consider holding or increasing short positions. It's important to look for signs of reversal, such as a bullish divergence in momentum indicators or the formation of reversal patterns like the double bottom.
Just like with the upper band, volume is another key factor to observe. A touch of the lower band with high volume can indicate strong selling pressure and a continuation of the downtrend. Conversely, a touch with low volume might suggest that the selling pressure is diminishing, signaling a potential reversal.
Price touching or exceeding the upper band suggests overbought conditions. As seen in the example below, after reaching the upper band, prices typically retreat towards the middle band or lower band.
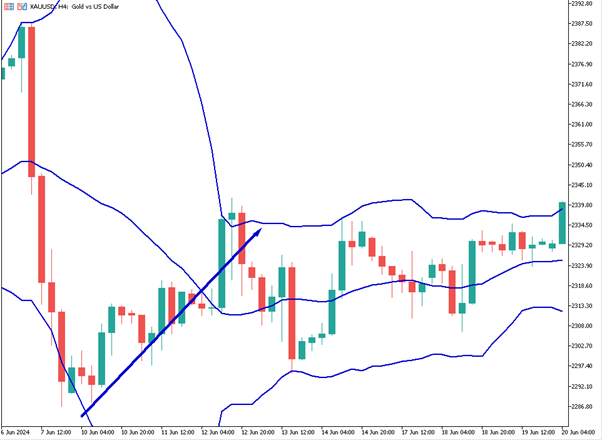
When the price touches or falls below the lower band, it suggests oversold conditions. As seen in the example below, after the price reaches below the lower band, it often retraces back towards the middle and upper bands.
When the bands tighten, it indicates a period of low volatility in the market. During this phase, prices tend to move within a narrow range, reflecting consolidation. Traders should be prepared for potential breakouts or breakdowns, as tightening bands signal that a major price move could be imminent.
Widening Bands, on the other hand, signify increasing volatility in the market. This occurs when prices start to fluctuate more widely, indicating that the market is becoming more active. They can signal the beginning of a new trend or the continuation of a strong existing trend.
|
Bollinger Band Action |
What This Indicates |
Potential Reaction |
|---|---|---|
|
Price touches or moves above the upper band |
Potential overbought condition |
Consider selling, shorting, or setting tighter stop-loss orders |
|
Price touches or falls below the lower band |
Potential oversold condition |
Consider buying or setting tighter stop-loss orders |
|
Middle band (moving average) slopes upward |
Indicates an uptrend |
Buy or hold long positions |
|
Middle band (moving average) slopes downward |
Suggests a downtrend |
Sell or hold short positions |
|
Bands narrow considerably (squeeze) |
Low volatility; potential for significant price move |
Prepare for a breakout; consider entry points |
|
Price consistently touches or exceeds the upper band in an uptrend |
Strong upward momentum |
Continue holding long positions; trail stop-loss orders |
|
Price consistently touches or falls below the lower band in a downtrend |
Strong downward momentum |
Continue holding short positions; trail stop-loss orders |
|
Price bounces off the lower band |
Potential support level |
Consider buying or holding long positions |
|
Price bounces off the upper band |
Potential resistance level |
Consider selling or holding short positions |
|
Bands begin to widen after a squeeze |
Increase in volatility; possible start of a new trend |
Prepare for entry; watch for confirmation signals |
|
Price rebounds from upper or lower bands toward the middle band |
Potential trading opportunities in ranging markets (Bollinger Bounce) |
Enter long or short positions; set appropriate stop-loss orders |
|
Price breaks out above the upper band with increased volume |
Signals potential bullish breakout |
Enter long positions; set stop-loss orders below recent lows |
|
Price breaks down below the lower band with increased volume |
Signals potential bearish breakdown |
Enter short positions; set stop-loss orders above recent highs |
|
Prolonged narrow bands (extended squeeze) |
Indicates an aggressive price move is coming |
Prepare for a larger breakout; consider increasing position size |
|
Tightening bands indicate lower volatility and consolidation |
Often a precursor to a major price move or breakout |
Prepare for a breakout; tighten stop-loss orders |
|
Tightening bands for an extended period |
Market uncertainty; no clear direction |
Adjust risk management; wait for clearer signals before entering positions |
Bollinger Bands and Moving Averages are both important tools in technical analysis, but they serve different purposes and provide insights into market conditions.
Bollinger Bands are primarily used to measure volatility. They consist of a middle band, which is a simple moving average, and two outer bands set two standard deviations away from the middle band. The distance between these bands expands and contracts based on market volatility.
Moving Averages, on the other hand, are used to smooth out price data to identify the direction of the trend over a specified period. They help generate buy and sell signals. For example, a common strategy is the moving average crossover, where a shorter-term moving average crosses above or below a longer-term moving average to indicate a potential buy or sell signal.
|
Bollinger Bands |
Moving Averages |
|
Measuring market volatility and identifying overbought/oversold conditions |
Smoothing out price data to identify trend direction |
|
Consist of a middle band (Simple Moving Average) and two outer bands set two standard deviations away from the middle band |
Can be Simple Moving Average (SMA) or Exponential Moving Average (EMA) |
|
Based on a moving average with bands that adjust according to standard deviation |
Calculated by averaging the price data over a specific period |
|
Helps identify uptrends and downtrends by analyzing the position of prices relative to the bands |
Identifies trends by smoothing price data; crossovers of short and long-term averages indicate potential buy/sell signals |
|
Indicates potential support and resistance levels by the position of the bands |
Acts as dynamic support and resistance levels |
|
Measures market volatility; bands expand during high volatility and contract during low volatility |
Does not directly measure volatility; smooths out price data |
|
Signals potential overbought/oversold conditions when prices move outside the bands |
Generates buy/sell signals through moving average crossovers |
|
Effective in various time frames; suitable for short, medium, and long-term trading |
Effective in various time frames; commonly used for medium to long-term trading |
|
Applicable to different markets, including stocks, forex, and commodities |
Applicable to different markets, including stocks, forex, and commodities |
|
Can be complex for beginners to interpret and integrate into trading strategies |
Generally simpler to understand and use compared to Bollinger Bands |
|
Adapts to changes in market volatility, providing dynamic insights |
Provides a consistent method for identifying trends, less adaptable to sudden changes in market volatility |
|
Can produce false signals, especially in ranging markets |
Less prone to false signals, but still possible, particularly in highly volatile markets |
How are Bollinger Bands calculated?
The calculation of the bands utilizes standard deviation and moving averages:
What technical indicators can be used alongside Bollinger Bands?
Common technical indicators used alongside Bollinger Bands include the Relative Strength Index (RSI), Moving Average Convergence Divergence (MACD), and volume indicators. These help confirm signals and provide additional market insights.
How should the volume be considered when trading with Bollinger Bands?
Volume should be considered as it can confirm the strength of price movements. High volume during price movements towards or outside the bands indicates stronger momentum, while low volume may suggest weaker trends.
How can Fibonacci retracement levels be used with Bollinger Bands?
Fibonacci retracement levels can be used with Bollinger Bands to identify potential support and resistance levels. When Fibonacci levels coincide with Bollinger Bands, they can provide stronger confirmation for entry and exit points.
How accurate are Bollinger Bands?
Bollinger Bands are a widely used technical analysis tool, but their accuracy depends on the market conditions and how they are used. They are effective in measuring volatility and identifying overbought or oversold conditions, but they should be used in conjunction with other indicators and analysis methods to increase accuracy.
Are Bollinger Bands good for day trading?
Yes, they can be effective for day trading. They help traders identify potential entry and exit points by showing periods of high and low volatility.
Sign up in seconds for free, access your platform, and start trading with ease.
 $200 Oil Scenario: The Chain Reaction Across Markets
What happens if oil hits $200? See the impact on global markets, sectors, inflation, and which industries could win or lose.
Detail Biggest Manipulations in Financial Market History
Financial markets have seen their share of manipulation over the years. Here are seven of the biggest cases in modern history.
Detail Petrodollar System: Why It Still Matters
Energy markets depend on supply routes, currency systems, and trade infrastructure determine prices, inflation, and financial stability across the global economy.
DetailThen Join Our Telegram Channel and Subscribe Our Trading Signals Newsletter for Free!
Join Us On Telegram!


