


Candlestick patterns are one of the most widely used tools by investors in financial markets to analyze price movements and make predictions about the future. With a history dating back centuries, this charting technique is used to understand the balance of supply and demand in the market and to gain insights into the direction of the market.
Candlestick charts provide investors with not only the closing price of an asset but also the opening, highest, and lowest prices, allowing for a more detailed analysis of the market. These charts are highly effective in understanding the psychology of market participants and deciphering the dynamics behind price movements.
In our article, you will find detailed information about candlestick patterns.
A candlestick pattern is a graphical representation that visualizes how an asset moves within a specific time period in financial markets. It displays the opening, closing, highest, and lowest prices in the form of a candlestick.
Candlestick patterns are used to analyze the sentiment of market participants, helping to determine whether the market is generally in an uptrend or downtrend. Each candlestick represents the price movement during a specific time frame and helps to understand the direction in which the market has moved during that period.
A candlestick in financial markets consists of four basic components that visualize and help analyze an asset's price movement over a specific time period:
When reading a candlestick, it is important to first pay attention to the body of the candle. The body represents the difference between the opening and closing prices, and this difference determines the color of the candlestick.
If the closing price is higher than the opening price, the candle is usually shown in white or green, indicating that prices have risen. Conversely, if the closing price is lower than the opening price, the candle is shown in black or red, indicating that prices have fallen.
The wicks or shadows at the top and bottom of the candle indicate the highest and lowest prices reached during that time period. The upper wick represents the highest price, while the lower wick shows the lowest price. If the wicks are long relative to the body, this indicates that prices moved within a wide range during the day.
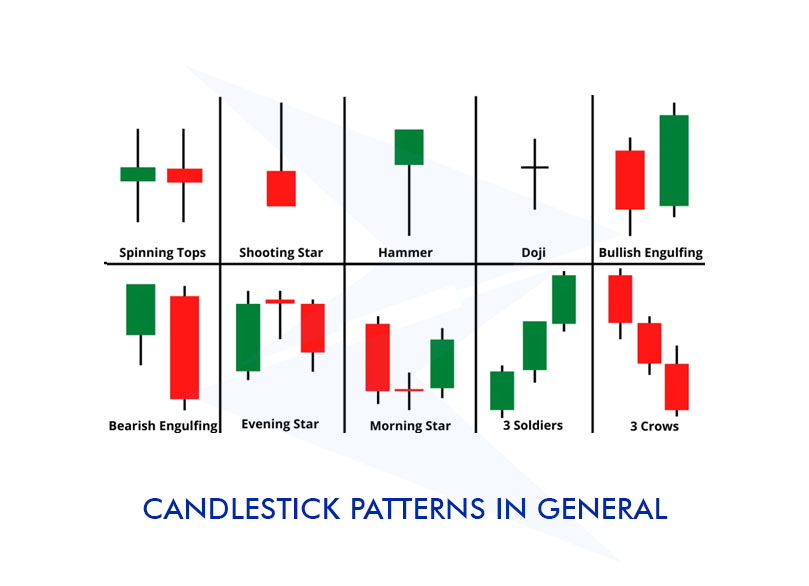
Candlestick patterns gain meaning not only from how a single candle is read but also from the interpretation of patterns formed by multiple candles. For example, if several consecutive candles appear in a certain order, it may indicate that a trend is forming or that the current trend is about to reverse.
A bullish candlestick pattern is interpreted as a sign that prices are likely to rise. It indicates that a downtrend may be ending and an uptrend may be starting.
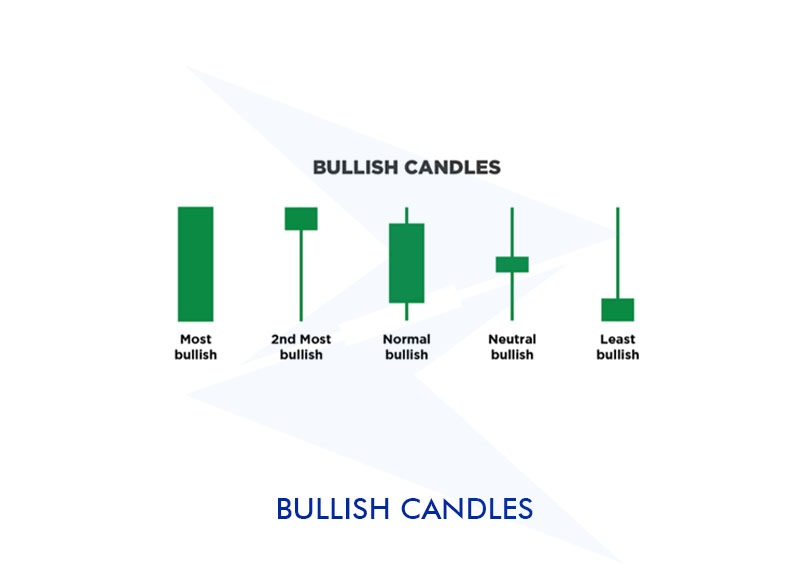
Bullish candlestick patterns can form from a single candlestick or from a combination of multiple candlesticks. A single candlestick pattern shows that prices were low at the opening but rose towards the close. In this case, the body of the candle is usually white or green, and the lower wick is long while the upper wick is short, indicating that buyers dominate throughout the day.
Bullish patterns formed by multiple candlesticks typically signal a strong trend reversal in the market. For example, the "Hammer" pattern forms with a candlestick that has a long lower wick, providing a strong signal that a downtrend may be ending. Additionally, the "Bullish Engulfing" pattern, which is a two-candle formation, occurs when the first candle shows a decline and the second candle represents a strong upward movement.
A bearish candlestick pattern is interpreted as a sign that prices are likely to fall. It suggests that the uptrend has ended, and the strength of sellers in the market has increased.
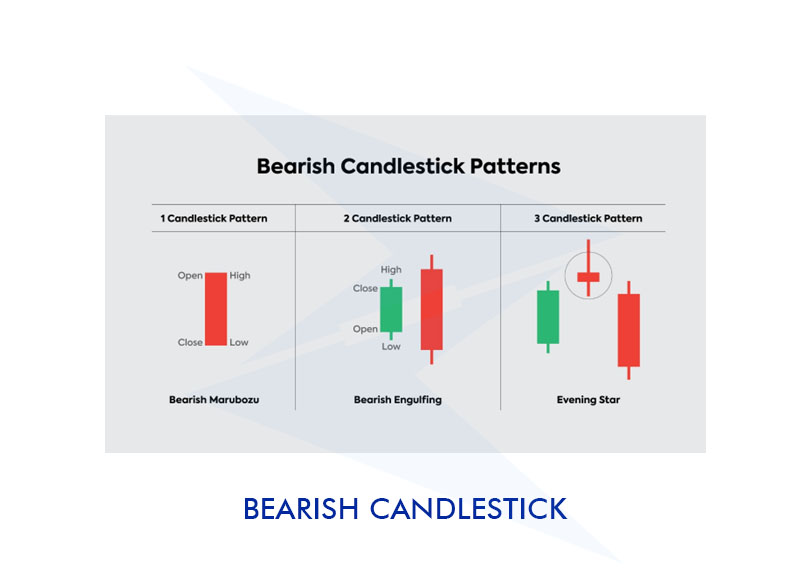
If it consists of a single candlestick, it indicates that prices were high at the opening but declined towards the close.
On the other hand, bearish patterns formed by multiple candlesticks typically signal a strong trend reversal in the market. For example, the "Inverted Hammer" or "Hanging Man" pattern forms with a candlestick that has a long upper wick, providing a strong signal that the uptrend may be ending.
Candlestick patterns are an important tool for investors in predicting future market movements. Different patterns provide different signals about the market's direction and help investors make strategic decisions.
Below is an example of a candlestick pattern on the chart:
The table below highlights key distinctions to help you navigate the nuances of forex compared to other financial markets.
| Feature | Forex Candles | Other Markets’ Candles |
| Market Operating Hours | 24 hours, 5 days a week | Generally limited to stock exchange hours |
| Volatility | High volatility, large movements in short time | Volatility varies by sector and market type |
| Price Gaps | Less common, as the market is continuously open | More common, occurring at market open and close |
| Liquidity | Generally high liquidity | Varies by market, may be low in some markets |
| News Impact | Global news and economic data have a significant impact | Typically sector-specific news is more impactful |
| Candle Body Length | Often short, sudden movements are common | Can be long or short depending on the sector |
| Timeframes | Various timeframes and short-term trades are common | Generally daily or weekly timeframes are preferred |
What does a Red (or Black) Candlestick mean?
A red or black candlestick indicates that prices have fallen. It shows that during a specific time period, the opening price of an asset was higher than the closing price. In other words, the market experienced a downward movement during that time.
What does White Candlestick mean?
A white candlestick represents a rise in prices. Particularly, a long-bodied white candlestick may indicate a strong upward trend.
What is the 3 Candlestick rule?
The 3 Candlestick rule is a technique that shows whether a trend is strengthening or reversing in the market when three consecutive candlesticks appear in a specific pattern. For example, three consecutive bullish candlesticks may indicate a strong uptrend, while three consecutive bearish candlesticks may signal a strong downtrend. This rule is used to determine whether a trend will continue or has a chance of reversing.
How do you interpret CandleSticks?
Candlesticks are visual tools used to understand the emotions and price movements of market participants. A Candlestick shows the opening, closing, highest, and lowest prices.
How can Candlestick patterns be combined with other technical analysis methods?
Candlestick patterns provide stronger and more reliable signals when combined with other technical analysis tools. For example, candlestick patterns can be analyzed along with moving averages, RSI (Relative Strength Index), or MACD indicators to better assess market trends. When combined with support and resistance levels, these patterns can provide greater accuracy in buy and sell decisions.
How can you avoid false candlestick signals?
To avoid false candlestick signals, it is important to evaluate patterns in conjunction with other technical analysis tools and market conditions rather than relying solely on the patterns themselves. Analyzing over broader timeframes can also help reduce the impact of false signals.
What are common mistakes related to Candlestick patterns?
Common mistakes with Candlestick patterns include misinterpreting the patterns, trading without sufficient confirmation signals, and confusing short-term signals with long-term ones. If investors trade without considering the market conditions in which the patterns form, the likelihood of error increases.
What are the differences between Candlestick charts and Bar charts?
Candlestick charts present the opening, closing, highest, and lowest prices in a more visual and understandable way. The body of the Candlestick indicates the direction and magnitude of the price movement, and the colors help quickly grasp this direction.
In bar charts, the opening and closing prices are represented by horizontal lines, and the direction of the price movement is not as easily discernible. Candlestick charts are visually richer, making it easier to interpret market participants' emotions and price movements.
Sign up in seconds for free, access your platform, and start trading with ease.
 $200 Oil Scenario: The Chain Reaction Across Markets
What happens if oil hits $200? See the impact on global markets, sectors, inflation, and which industries could win or lose.
Detail Biggest Manipulations in Financial Market History
Financial markets have seen their share of manipulation over the years. Here are seven of the biggest cases in modern history.
Detail Petrodollar System: Why It Still Matters
Energy markets depend on supply routes, currency systems, and trade infrastructure determine prices, inflation, and financial stability across the global economy.
DetailThen Join Our Telegram Channel and Subscribe Our Trading Signals Newsletter for Free!
Join Us On Telegram!


