


Technical analysis is a tool used to predict price movements in financial markets and support investment decisions. Chart patterns in this method offer traders various interpretation opportunities. These patterns, which are used to understand past price movements and potential future directions, reflect the behavior and expectations of market participants.
Triangle formations are one of the technical analysis tools that indicate a period of price consolidation and suggest that a major movement is imminent.
A triangle chart pattern is a technical analysis formation where prices move within a narrowing range for a certain period and eventually break out of that range. It gets its name because it forms a triangular shape.
Triangle formations feature support and resistance levels that converge, causing prices to squeeze into a tighter range. They typically appear during periods of market uncertainty and when prices approach a decision point.
Triangle patterns are classified into different types based on the direction and shape of price movements. There are three main types of triangle patterns:
The ascending triangle pattern forms when prices hit the upper resistance level and then pull back, finding support at the lower support level before rising again. You can see this in the chart pattern below:
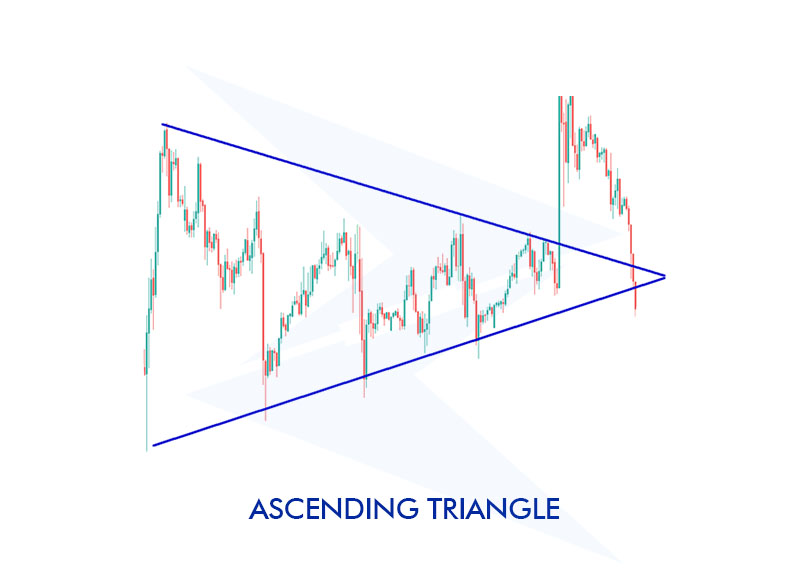
Let's consider an example with a stock. It encounters resistance at the $50 level multiple times but each pullback finds support at $45 and moves up. In this scenario, a strong rise can be expected when the $50 resistance is broken.
The descending triangle pattern forms when prices hit the lower support level and then rise, encountering resistance at the upper resistance level before falling again. Let's examine this in the chart below:
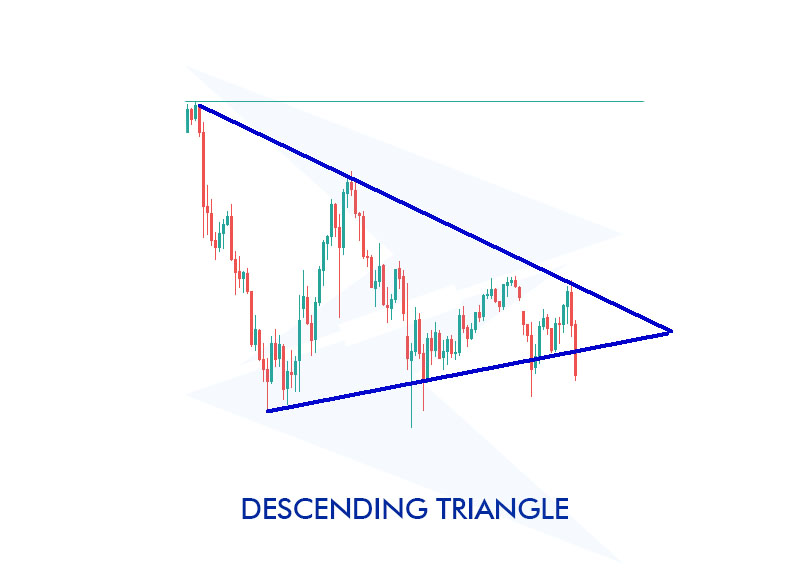
Imagine a currency pair encountering support at the $1.20 level multiple times, but each rise is met with lower resistance levels. In this scenario, a strong decline can be expected when the $1.20 support is broken.
A symmetrical triangle pattern forms when both the upper resistance level and the lower support level converge, causing the price to move within a narrowing range. Below is an example:
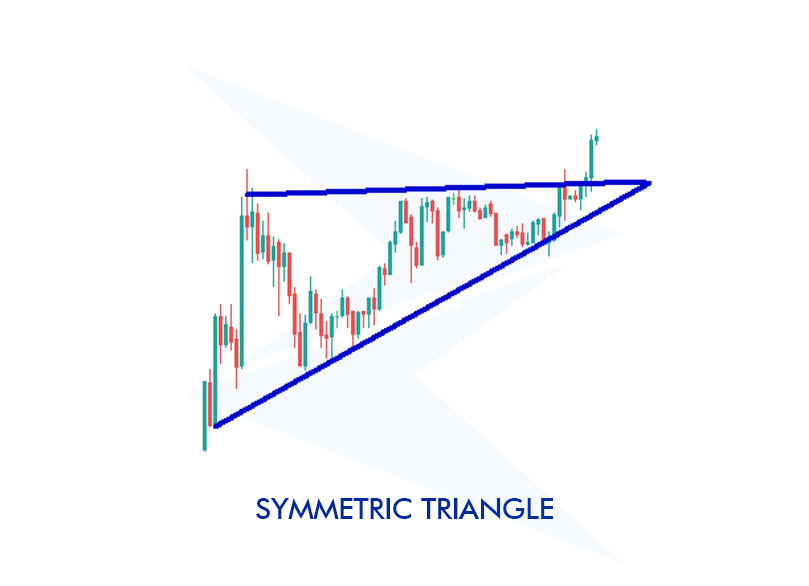
For example, let's assume a commodity is moving in a narrowing range with resistance at $70 and support at $60. A breakout outside the triangle signals the start of a new trend. If the price breaks above the $70 resistance, an upward trend is expected. Conversely, if it breaks below the $60 support, a downward trend is anticipated.
Triangle formations have a structure where support and resistance levels gradually converge. During this process, prices become confined within a narrowing channel, increasing market uncertainty. As the triangle's apex approaches, prices move closer to the support and resistance levels, leading to decreased volatility.
The formation completes when prices break out from either the support or resistance levels. This breakout is usually supported by high volume. In ascending formations, the breakout is typically upwards; in descending formations, it is downwards; and in symmetrical formations, the breakout can occur in either direction.
Volume is generally a good indicator of market participants' conviction when analyzing price movements. This is also true for the triangle formation.
Typically, volume decreases throughout the triangle formation. As prices move within a narrowing range, trading volume drops, indicating increased uncertainty in the market. When the triangle's apex is approached, the low volume levels suggest that traders are indecisive and that a significant move is imminent.
A sudden increase in volume at the breakout indicates that the breakout is strong and reliable. Rising volume signals that there is a strong buying or selling pressure in the market, and that prices are likely to continue in the direction of the breakout. If the volume remains low, the breakout is more likely to be temporary.
What market conditions do triangle formations occur in?
Triangle formations can typically be observed during consolidation periods when the market is moving sideways, and uncertainty prevails. This pattern, where prices are compressed into a narrowing range, indicates that the market is approaching a decision point.
How can I distinguish false signals in triangle formations?
To distinguish false signals, paying attention to volume analysis is crucial. Genuine breakouts are usually supported by high volume, while breakouts occurring with low volume are generally less reliable. Additionally, observing price movements after the breakout and looking for confirmation signals is essential.
Do triangle formations signal trend continuation or trend reversal?
Triangle formations can signal both trend continuation and trend reversal, depending on the direction of the breakout. In ascending triangle formations, an upward breakout suggests the trend will continue, while in descending triangle formations, a downward breakout indicates the continuation of the downtrend. Symmetrical triangles can break out in either direction.
Is a triangle pattern bullish?
A triangle pattern can be bullish depending on its type and the direction of the breakout. An ascending triangle is typically considered a bullish continuation pattern, indicating the potential for the price to move higher. However, symmetrical triangles can break out in either direction, and descending triangles are typically bearish.
What is the triangle breakout strategy?
The triangle breakout strategy involves identifying a triangle formation and waiting for a clear breakout above resistance or below support. Traders typically enter a position in the direction of the breakout, using the height of the triangle to set price targets and placing stop-loss orders just outside the opposite side of the triangle to manage risk.
Sign up in seconds for free, access your platform, and start trading with ease.
 $200 Oil Scenario: The Chain Reaction Across Markets
What happens if oil hits $200? See the impact on global markets, sectors, inflation, and which industries could win or lose.
Detail Biggest Manipulations in Financial Market History
Financial markets have seen their share of manipulation over the years. Here are seven of the biggest cases in modern history.
Detail Petrodollar System: Why It Still Matters
Energy markets depend on supply routes, currency systems, and trade infrastructure determine prices, inflation, and financial stability across the global economy.
DetailThen Join Our Telegram Channel and Subscribe Our Trading Signals Newsletter for Free!
Join Us On Telegram!


