


Wedge patterns are chart formations where prices move within a narrow range, creating structures that resemble a triangle. These patterns typically emerge during periods when prices are consolidating, indicating that a major price movement in a specific direction is imminent. The formation reflects market participants' perceptions and expectations regarding a particular asset.
Wedge formations help investors understand market trends and potential breakout points. They are divided into two main types: rising wedges and falling wedges, each providing different signals in various market conditions.
In our article, you can find detailed information about wedge patterns.
Resembling a triangle in appearance, the wedge pattern is a technical analysis formation where prices move within a narrowing range. As support and resistance levels converge and prices become squeezed, this pattern typically appears during periods of uncertainty and as the market approaches a decision point.
For traders, the function of wedge patterns is to help determine whether a trend will continue. Observed just before a strong breakout, this formation can be considered an effective buy or sell signal.
Wedge patterns are divided into two main categories: ascending and descending.
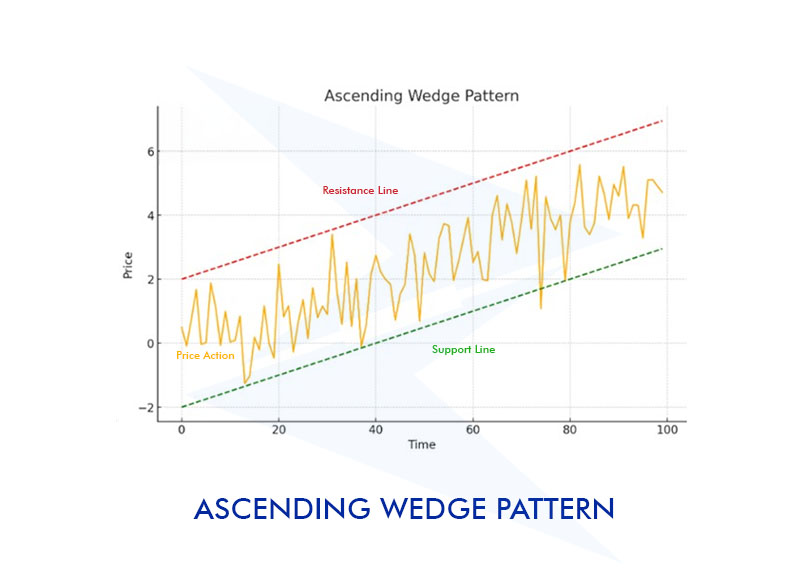
The rising wedge pattern typically forms during an uptrend. The upper boundary (resistance) line and the lower boundary (support) line converge, and price movements become increasingly narrow. This situation can be observed in the following chart:
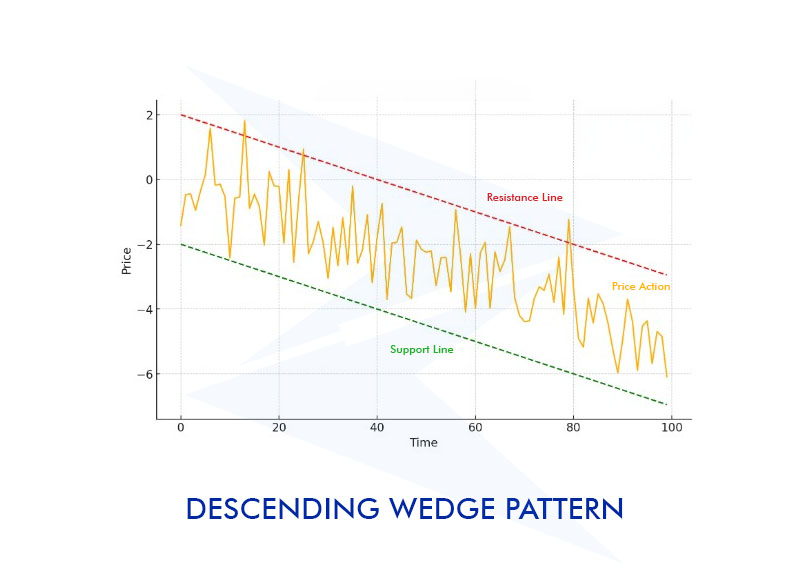
In a descending wedge pattern, a downtrend is observed that becomes compressed within a certain range. Prices are generally in a downtrend, but there are occasional short-term rises and falls. Let's examine this together in the following chart:
Is a wedge a continuation or a reversal pattern?
A wedge pattern can be considered both a continuation and a reversal pattern. This depends on the trend in which the pattern forms and the direction of the breakout. A rising wedge is generally seen as a bearish reversal signal, while a falling wedge is typically considered a bullish reversal signal.
Is a falling wedge pattern bullish?
Yes, a falling wedge pattern is considered bullish. The price compresses and shows a downward movement within a narrowing range, increasing the likelihood of an upward breakout at some point.
Is a rising wedge pattern bullish or bearish?
A rising wedge pattern is generally considered bearish. As prices rise within a narrowing range, this typically creates the expectation that prices will break downward.
How often does a wedge pattern in technical analysis occur?
Wedge patterns can appear with varying frequency depending on market conditions and the time frame being analyzed. However, they are generally not as common as other technical patterns and can take time to identify. A falling wedge pattern usually forms after a downtrend has been in place for about three months. Similarly, a rising wedge pattern typically appears within a range of three to six months.
What is the difference between a wedge pattern and a triangle pattern?
The main difference between wedge and triangle patterns is the slope and trend direction of the formations. Wedge patterns are sloped either upward or downward and generally indicate a trend reversal. Triangle patterns, on the other hand, can be symmetrical, ascending, or descending and usually signal the continuation of the current trend. Additionally, wedge patterns have a narrower structure, while triangle patterns tend to have a wider formation.
Sign up in seconds for free, access your platform, and start trading with ease.
 $200 Oil Scenario: The Chain Reaction Across Markets
What happens if oil hits $200? See the impact on global markets, sectors, inflation, and which industries could win or lose.
Detail Biggest Manipulations in Financial Market History
Financial markets have seen their share of manipulation over the years. Here are seven of the biggest cases in modern history.
Detail Petrodollar System: Why It Still Matters
Energy markets depend on supply routes, currency systems, and trade infrastructure determine prices, inflation, and financial stability across the global economy.
DetailThen Join Our Telegram Channel and Subscribe Our Trading Signals Newsletter for Free!
Join Us On Telegram!


