


The 52-week high/low represents the highest and lowest price levels a security has reached in the past 52 weeks. It is a widely used metric in financial markets, providing important insights into the market's overall trend, volatility, and the performance of a particular asset.
When an asset reaches its 52-week high, it is generally considered a sign of a strong upward trend in the market. This often increases investor interest and buying appetite. On the other hand, when an asset hits its 52-week low, it is typically seen as an indication of a weak market trend or selling pressure from traders.
The 52-week high refers to the highest price level a stock, index, or other financial asset has reached within the past 52 weeks.
When an asset hits its 52-week high, it is often interpreted as a sign of strong demand and positive future expectations among market participants. However, these levels can also serve as resistance points, where prices may struggle to rise further as some traders opt to take profits.
The 52-week high is frequently referenced in both technical and fundamental analysis. Investors use this metric to evaluate an asset's growth potential or determine whether it is overvalued. It also serves as an indicator for understanding trend direction and making strategic decisions.
The lowest price that an asset has experienced in the previous 52 weeks is known as a 52-week low. It frequently represents times when the asset was not well-regarded by the market or when sentiment was negative.
When an asset reaches its 52-week low, it usually means that the market is weak and that traders are selling more. However, some investors may consider 52-week low levels to be buying opportunities, and they can also be viewed as possible support areas.
The distinctions between a 52-week high and a 52-week low are shown in the following table:
| 52-Week High | 52-Week Low |
| The highest price level reached in the past year. | The lowest price level reached in the past year. |
| Indicates strong demand and positive expectations. | Indicates weak demand and negative expectations. |
| Serves as a resistance level or growth indicator. | Serves as a support level or recovery indicator. |
| Might encourage profit-taking or continued buying. | Might trigger bargain hunting or further selling. |
| Suggests an uptrend or bullish sentiment. | Suggests a downtrend or bearish sentiment. |
| Indicates possible overvaluation. | Indicates possible undervaluation. |
| Reflects trader optimism. | Reflects investor pessimism. |
These values provide a historical overview of an asset's price movements and are used by investors to evaluate the current market condition or predict future price movements.
The 52-week high indicates periods when the asset has experienced strong demand or positive market conditions. This level often attracts trader interest, leading to increased buying pressure.
The 52-week low reflects periods of value loss or negative market conditions for the asset. At these levels, selling pressure typically increases, and market sentiment turns negative.
One of the key advantages of this indicator is that it allows traders to analyze extreme price increases or decreases. For example, if an asset's current price is near its 52-week high, it could represent a potential resistance point for traders. Similarly, if the price approaches the 52-week low, it may be considered a support level.
The 52-week high/low is an indicator that helps traders better understand market movements and make strategic decisions. Let’s explore how this indicator works with examples.
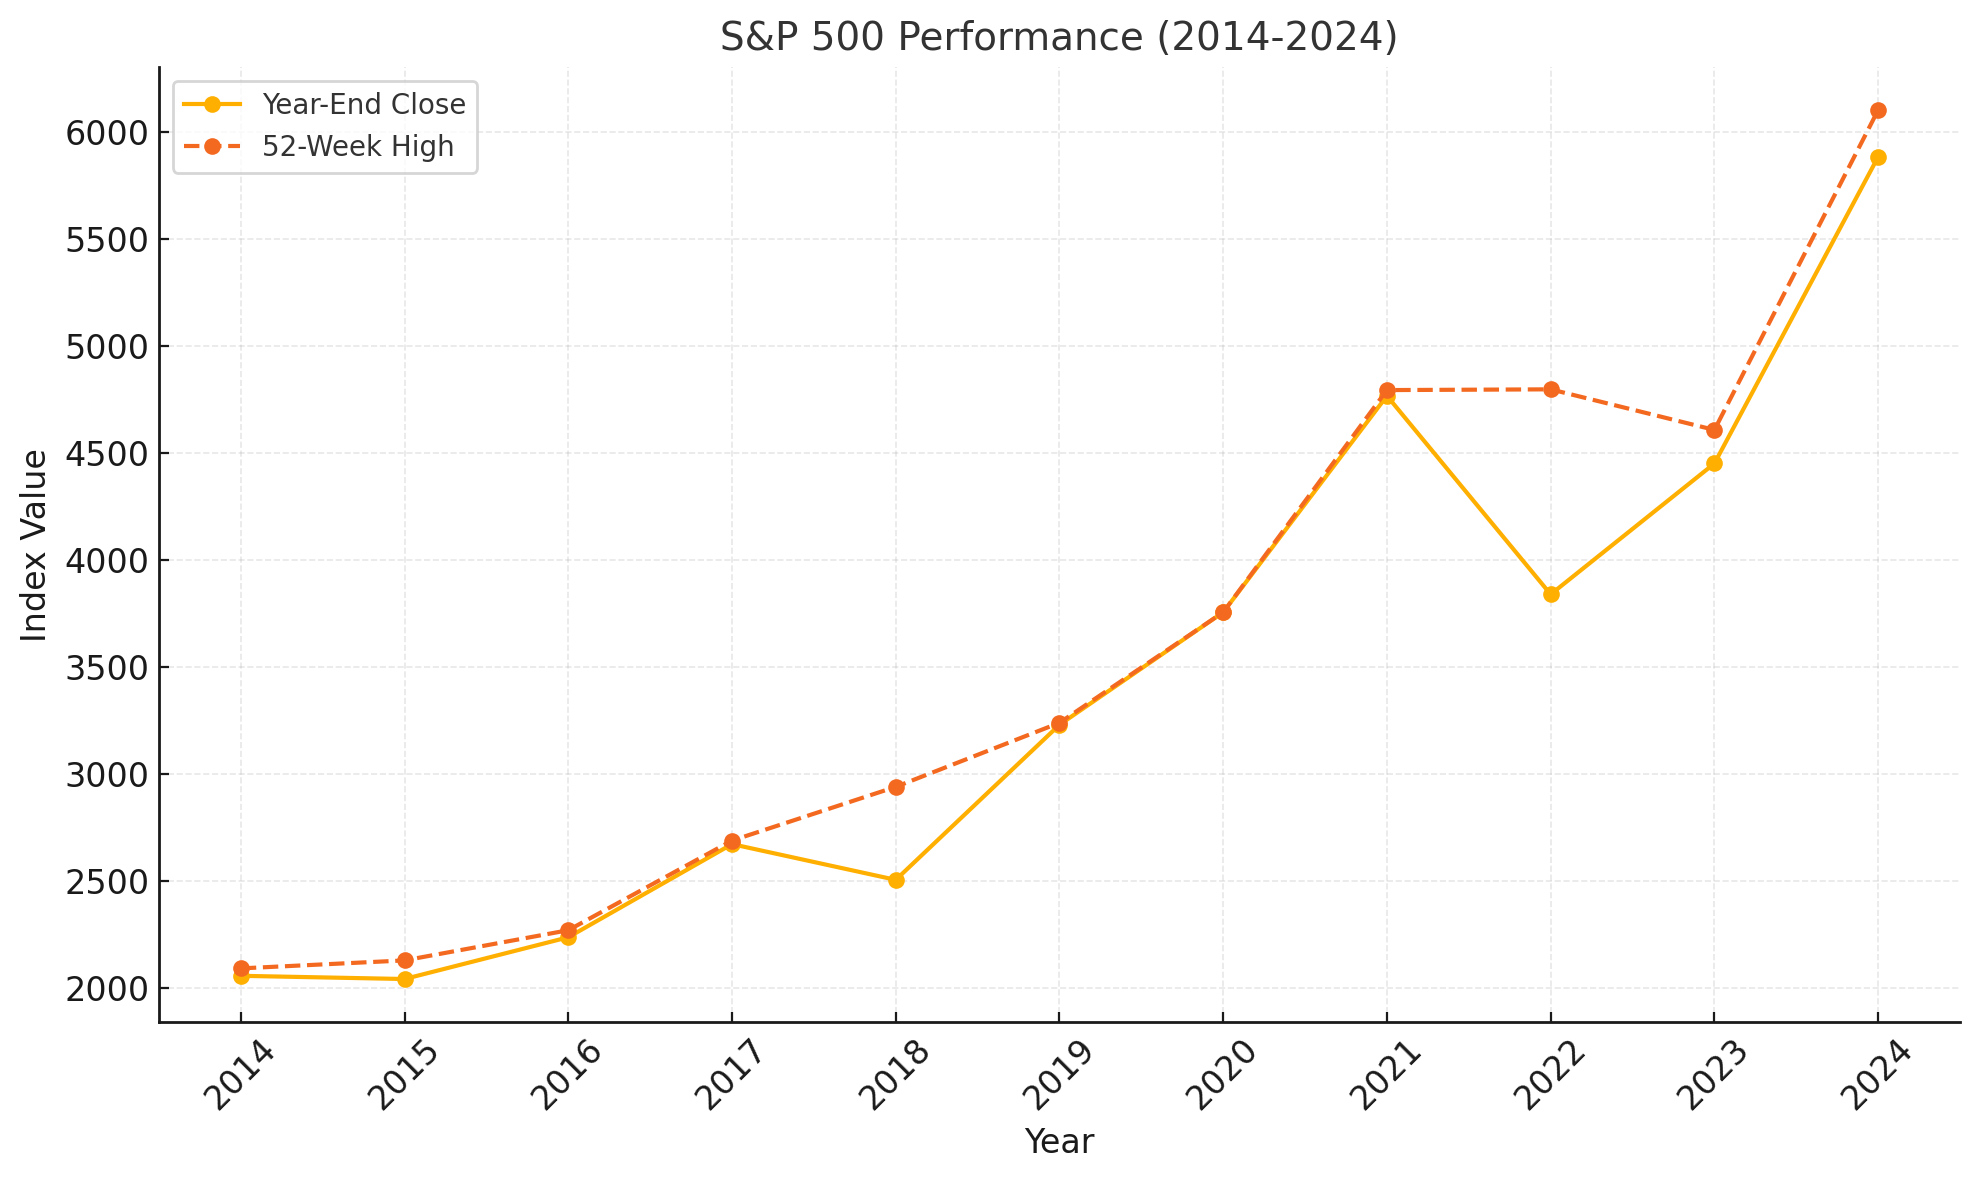
The 52-week high chart for the S&P 500 shows the market's peak performance over the past decade, reflecting moments of optimism and strong economic momentum. Notably, 2024 marked an all-time high of 6,099.97 for the S&P 500, highlighting the resilience of equities on global shifts.
| Year | S&P 500 Year-End Close | 52-Week High |
| 2014 | 2,058.90 | 2,093.55 |
| 2015 | 2,043.94 | 2,130.82 |
| 2016 | 2,238.83 | 2,271.72 |
| 2017 | 2,673.61 | 2,690.16 |
| 2018 | 2,506.85 | 2,940.91 |
| 2019 | 3,230.78 | 3,240.02 |
| 2020 | 3,756.07 | 3,756.07 |
| 2021 | 4,766.18 | 4,793.06 |
| 2022 | 3,839.50 | 4,796.56 |
| 2023 | 4,450.48 | 4,607.07 |
| 2024 | 5,881.63 | 6,099.97 |
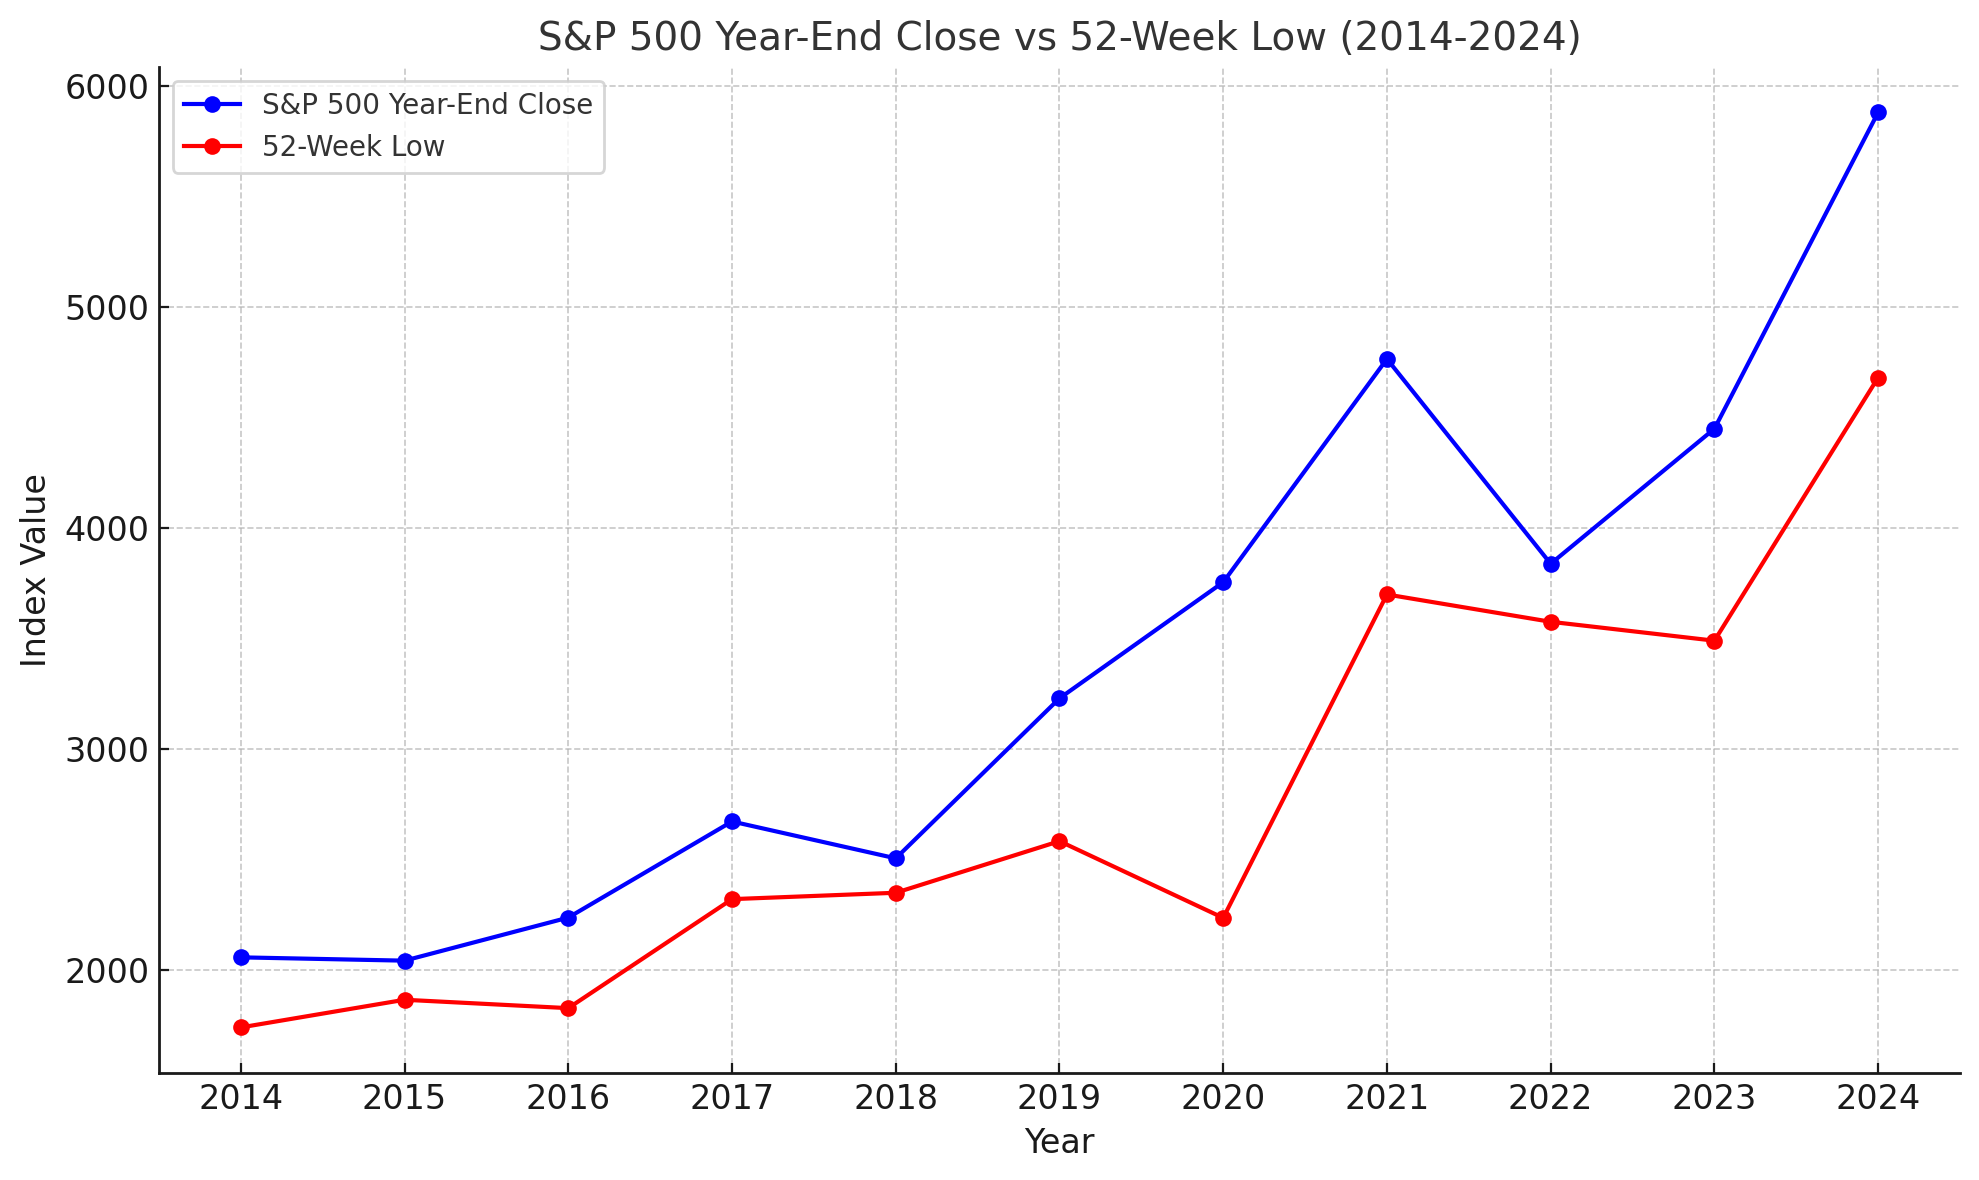
On the other hand, the 52-week low table and chart for the S&P 500 reveals periods of market pullbacks and investor caution. For example, the sharp drop to 2,237.40 in 2020 highlights the impact of the pandemic-induced economic turbulence.
| Year | S&P 500 Year-End Close | 52-Week Low |
| 2014 | 2,058.90 | 1,741.89 |
| 2015 | 2,043.94 | 1,867.01 |
| 2016 | 2,238.83 | 1,829.08 |
| 2017 | 2,673.61 | 2,322.25 |
| 2018 | 2,506.85 | 2,351.10 |
| 2019 | 3,230.78 | 2,584.59 |
| 2020 | 3,756.07 | 2,237.40 |
| 2021 | 4,766.18 | 3,700.65 |
| 2022 | 3,839.50 | 3,577.03 |
| 2023 | 4,450.48 | 3,491.58 |
| 2024 | 5,881.63 | 4,682.11 |
Calculating the 52-week high/low involves identifying the highest and lowest price points a security has reached over the last 52 weeks. This process is typically straightforward and relies on simple data analysis.
First, collect the price data for the security over the past 52 weeks. This data usually includes daily closing prices, but intraday price movements can also be considered in some cases. Then, follow these steps:
Most financial data providers and trading platforms automatically calculate and display these levels, eliminating the need for manual calculations by traders.
52-week high/low levels are important reference points for traders. These levels provide historical insights into an asset's performance and serve as a tool to understand market dynamics.
Some evaluations that can be made using the 52-week high/low metric are as follows:
How to trade using 52-week data?
Using 52-week data can be beneficial for understanding market trends and making strategic buy or sell decisions. When an asset reaches its 52-week high, it typically indicates a strong upward trend, which may support long positions. Conversely, when an asset hits its 52-week low, it is often considered oversold by investors. These levels can also be used as support and resistance points to plan entry and exit strategies.
How can traders use 52-week levels in trend analysis?
52-week high and low levels serve as key reference points for identifying the direction of a trend. If the price approaches the 52-week high, it may signal a continuation of the upward trend. Similarly, if the price moves closer to the 52-week low, it indicates market weakness. Additionally, when the price breaks through these levels, it can be interpreted as the start of a new trend.
How can 52-week levels be used in scalping strategies?
In scalping strategies, 52-week levels provide guidance for quick and short-term trades. For instance, if the price nears the 52-week high and encounters resistance, this may offer a short-term pullback opportunity. On the other hand, if the price is close to the 52-week low and finds support, short-term buy positions may be considered.
How can 52-week high/low levels indicate trend reversal signals?
When an asset starts declining from its 52-week high, it may signify a potential trend reversal, often caused by profit-taking or reduced market demand. Similarly, if the price moves upward from its 52-week low, it could indicate recovery or the beginning of a new upward trend. These reversal signals are more reliable when confirmed by other technical indicators.
What to expect from a stock recovering from a 52-week low?
When a stock begins to recover from its 52-week low, it often indicates renewed investor interest in the asset. Traders may see this as the start of a potential trend reversal and move toward long positions. However, to assess whether this recovery is sustainable, factors like trading volume, and fundamental data should be considered.
Sign up in seconds for free, access your platform, and start trading with ease.
 $200 Oil Scenario: The Chain Reaction Across Markets
What happens if oil hits $200? See the impact on global markets, sectors, inflation, and which industries could win or lose.
Detail Biggest Manipulations in Financial Market History
Financial markets have seen their share of manipulation over the years. Here are seven of the biggest cases in modern history.
Detail Petrodollar System: Why It Still Matters
Energy markets depend on supply routes, currency systems, and trade infrastructure determine prices, inflation, and financial stability across the global economy.
DetailThen Join Our Telegram Channel and Subscribe Our Trading Signals Newsletter for Free!
Join Us On Telegram!


