


The Average True Range (ATR) is a technical analysis indicator used to measure volatility in financial markets. Developed by J. Welles Wilder Jr., this indicator is particularly useful in volatile markets such as Forex, commodities, and stock CFDs to determine the strength and level of price fluctuations.
The calculation involves averaging the true range values over a specified period, usually 14 periods. The true range is determined by selecting the largest of the following three values: the difference between the current period's high and low prices, the difference between the previous closing price and the current period's high price, and the difference between the previous closing price and the current period's low price.
In this article, you can gain more detailed information about the Average True Range.
ATR is a non-directional indicator, so when it expands, it can indicate both selling pressure and buying pressure. High values usually result from a sharp rise or fall and are unlikely to persist for long periods.
A low ATR value indicates a series of periods with small ranges, signifying lower volatility. Prolonged low values can indicate a consolidation area and the possibility of a continuation move or reversal.
ATR is very useful for stop levels or entry triggers. While fixed dollar points or percentage stops do not account for volatility, ATR stops adapt to sharp price movements or consolidation areas, which can trigger abnormal price movements in either direction.
ATR measures how wide price movements are over a specified period (typically 14 periods). To calculate it, you first need to determine the true range for each period.
To calculate the true range, follow these steps:
The True Range Formula:
TR = max([Current High − Current Low, |Current High − Previous Close|, |Current Low−Previous Close|])
Then, the Average True Range can be calculated:
The Average True Range Formula:
ATR=(n1)∑i=1nTRi
*n represents the number of periods
**TRi is the true range for each period i.
The ATR indicator helps traders understand the level of market volatility and the strength of price movements. When the value is high, it indicates large price fluctuations and increased volatility in the market. This situation suggests that there may be strong buying or selling pressure and that a distinct trend is present in the market.
A low ATR value indicates that price movements are limited to a narrow range and volatility is low. This may suggest a period of consolidation or uncertainty in the market.
It is also used to set stop-loss levels and optimize risk management strategies. Using ATR to set wider stop-loss levels during periods of high volatility can help investors protect themselves from abnormal price movements.
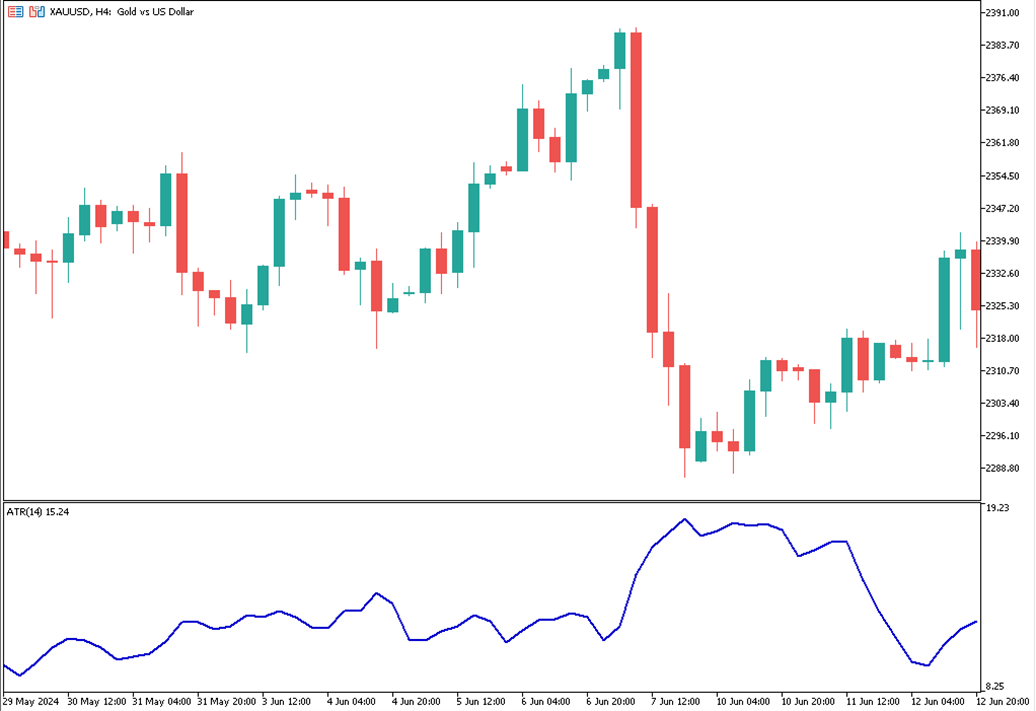
Here's an example of an ATR chart:
As an example of using ATR, let's examine the true range for a 14-day period together:
| Day | Highest Price (Dollar) | Lowest Price (Dollar) | Previous Day’s Close Price (Dollar) |
| 1 | 22.50 | 21.00 | 22.00 |
| 2 | 23.00 | 21.50 | 21.80 |
| 3 | 23.20 | 22.00 | 22.50 |
| 4 | 24.00 | 22.50 | 23.00 |
| 5 | 24.50 | 23.00 | 23.80 |
| 6 | 25.00 | 23.50 | 24.00 |
| 7 | 25.50 | 24.00 | 24.80 |
| 8 | 26.00 | 24.50 | 25.20 |
| 9 | 26.50 | 25.00 | 25.80 |
| 10 | 27.00 | 25.50 | 26.20 |
| 11 | 27.50 | 26.00 | 26.80 |
| 12 | 28.00 | 26.50 | 27.00 |
| 13 | 28.50 | 27.00 | 27.50 |
| 14 | 29.00 | 27.50 | 28.00 |
Next, we need to calculate the true range (TR) for each day:
| Day | H-L | H-Cp | L-Cp |
| 1 | 1.50 | 0.50 | -1.00 |
| 2 | 1.50 | 1.20 | -0.30 |
| 3 | 1.50 | 0.70 | -0.50 |
| 4 | 1.50 | 1.00 | -0.50 |
| 5 | 1.50 | 0.70 | -0.80 |
| 6 | 1.50 | 1.00 | -0.70 |
| 7 | 1.50 | 0.70 | -0.80 |
| 8 | 1.50 | 0.80 | -0.70 |
| 9 | 1.50 | 0.70 | -0.80 |
| 10 | 1.50 | 0.80 | -0.70 |
| 11 | 1.50 | 0.70 | -0.80 |
| 12 | 1.50 | 0.80 | -0.70 |
| 13 | 1.50 | 1.00 | -0.50 |
| 14 | 1.50 | 1.00 | -0.50 |
Let's sum up the highest values for the 14 days:
1.50 + 1.50 + 1.20 + 1.50 + 1.50 + 1.50 + 1.50 + 1.50 + 1.50 + 1.50 + 1.50 + 1.50 + 1.50 + 1.50 = 20.40
To calculate the initial ATR value, we divide this total by 14:
20.40 / 14 = 1.46
To calculate the ATR for the current period:
Therefore, in this example, the average volatility for the asset is $1.46.
How do you read ATR values?
ATR values are read by looking at the numerical output of the ATR indicator on a chart. Higher ATR values indicate increased volatility, meaning larger price movements within a given period. Conversely, lower ATR values indicate lower volatility and smaller price movements.
How is ATR used in Forex trading?
In Forex trading, ATR is used to measure market volatility and to set appropriate stop-loss levels. Traders use ATR to determine the average range of price movements for a currency pair.
What is the best period setting for ATR?
The most common period setting is 14, as suggested by the creator of the ATR, J. Welles Wilder Jr. However, shorter periods like 7 or 10 can be used for more responsive, short-term trading, while longer periods like 20 or 50 can be used for a smoother, long-term perspective.
Is ATR suitable for day trading?
Yes, ATR is suitable for day trading. By understanding the average range of price movements within a trading day, day traders can make more informed decisions about entry and exit points.
How can ATR be used to identify potential breakouts?
ATR can be used to identify potential breakouts by highlighting periods of increased volatility. When values rise, it indicates that price movements are becoming more significant, which could signal an upcoming breakout.
What are the common mistakes traders make when using ATR?
Common mistakes include relying solely on ATR without considering other indicators, using an inappropriate period setting that doesn't match the trading strategy, and misinterpreting high ATR values as a definitive indicator of market direction. Additionally, traders might set stop-loss levels too close to the current price, not allowing enough room for typical market fluctuations.
Sign up in seconds for free, access your platform, and start trading with ease.
 $200 Oil Scenario: The Chain Reaction Across Markets
What happens if oil hits $200? See the impact on global markets, sectors, inflation, and which industries could win or lose.
Detail Biggest Manipulations in Financial Market History
Financial markets have seen their share of manipulation over the years. Here are seven of the biggest cases in modern history.
Detail Petrodollar System: Why It Still Matters
Energy markets depend on supply routes, currency systems, and trade infrastructure determine prices, inflation, and financial stability across the global economy.
DetailThen Join Our Telegram Channel and Subscribe Our Trading Signals Newsletter for Free!
Join Us On Telegram!


