


A Doji is a candlestick pattern that signifies indecision in the markets. It occurs when the opening and closing prices of an asset are nearly identical within a specific time frame.
In the formation, the candlestick has a very small or nearly non-existent body, with only upper and lower wicks visible. It indicates that the balance between buyers and sellers has not shifted, and both sides remain undecided.
A Doji pattern often suggests that a trend may be coming to an end or that a strong directional change in the market is imminent. However, it should not be considered as a standalone signal and should be evaluated alongside other technical indicators. They can be observed in both bullish and bearish trends.
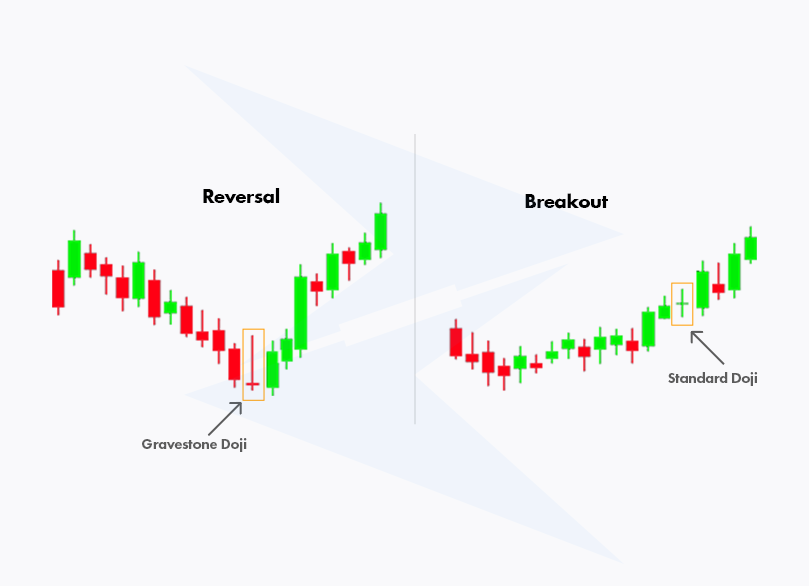
The Doji formation indicates to traders that there is indecision in the market and that the balance between buyers and sellers has not shifted. This situation can signal that a trend is about to end or that the market may be preparing for a reversal or breakout.
Especially after a strong upward or downward trend, the appearance of a Doji suggests that traders should review their positions and be prepared for a potential trend reversal.
A Red Doji is a candlestick pattern where the opening and closing prices are very close to each other, but the close is slightly lower than the open. The formation indicates market indecision, with sellers having a slight advantage.
It is often interpreted as a bearish signal and, when it appears at the end of an uptrend, can serve as a warning sign for traders.
When the opening and closing prices of a candlestick pattern are extremely near to one another, but the close is slightly higher than the open, it is known as a green dagger. This formation shows a little edge for buyers and a balance between sellers and buyers.
When a Green Doji emerges at the end of a downward trend, it may be interpreted as a possible positive indication.
| Doji Type | Description | Market Signal | Common Occurrence |
| Red | Opening and closing prices are very close, but the close is slightly lower than the open. | Indecision, slight bearish signal | Often seen at the end of an uptrend |
| Green | Opening and closing prices are very close, but the close is slightly higher than the open. | Indecision, slight bullish signal | Often seen at the end of a downtrend |
A Doji forms when the opening and closing prices of an asset are nearly the same during a specific time period. For the formation to occur, prices move both upward and downward during this period, but the closing price ends up very close to the opening price. The body of the candle is quite small, almost imperceptibly thin.
Doji usually shows up when the market is uncertain. It frequently occurs when the market is looking for direction or following a strong trend. It signals that a trend is waning and a possible reversal may be approaching when it emerges near the end of a bullish or bearish trend.
Furthermore, Doji is a common indicator of sideways markets, indicating that buyers and sellers are in balance and that the market is undecided. When predicting the future direction of the market in such circumstances, traders are advised to exercise caution by the Doji formation.
There are 6 types of Doji candles, as listed below. However, please note that only the first 3 are relatively important.
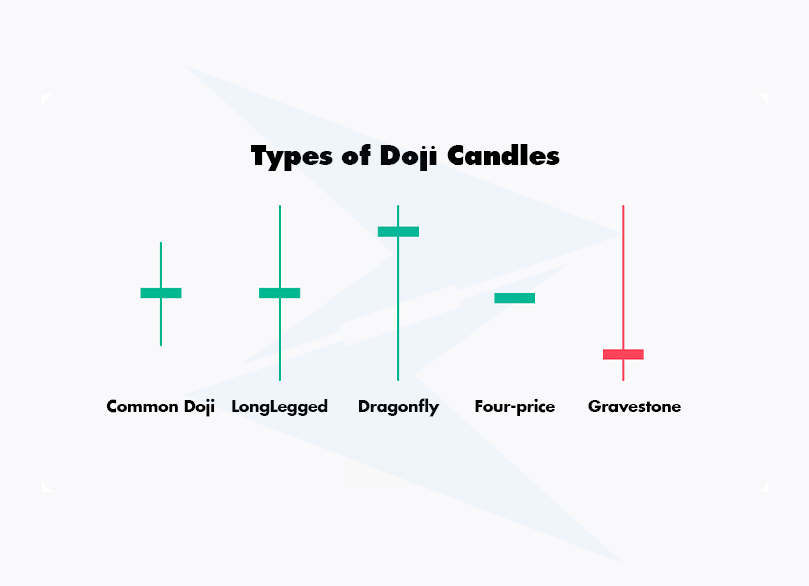
The Gravestone Doji is a formation where the opening and closing prices occur at the lowest point of the day. The upper wick is long, while the lower wick is nonexistent or very short. This formation shows that buyers were unsuccessful in pushing the prices higher and that sellers have taken control. It is typically seen at the end of an uptrend and is considered a bearish signal.
The opening and closing prices of a candlestick pattern known as the Dragonfly Doji happen at the peak of the day. The upper wick is either very short or nonexistent, while the lower wick is long. This pattern suggests that although sellers dominated the session, purchasers took back control and drove prices higher at the end. At the conclusion of a downward trend, it could indicate a possible bullish reversal.
The Long Legged Doji is a formation in which the upper and lower wicks are both lengthy, yet the opening and closing prices are quite near to one another. This shows a state of uncertainty and equilibrium between buyers and sellers. It usually indicates market uncertainty and can occur near the end of both uptrends and downtrends.
The Standard one has short upper and lower wicks and almost equal opening and closing prices. This can occur at the end of any trend and indicates market indecisiveness.
Even though the Standard Doji by itself might not give off a strong signal, it should be used in conjunction with other indicators.
The Price candle has short wicks and a very small body. It suggests that there is equilibrium between buyers and sellers because the price movement has happened within a very small range.
The Price Doji is a symbol for uncertainty and stagnation in the market.
The pattern known as the “Neutral” has nearly equal-length wicks on both sides and identical opening and closing values. It denotes a state of perfect equilibrium between buyers and sellers and indicates uncertainty in the market.
The market's future move is not clearly indicated by this kind of Doji.
| Doji Type | Description | Market Signal | Common Occurrence |
| Gravestone | Opening and closing prices are at the lowest point of the day. Long upper wick, no or very short lower wick. Typically a bearish signal at the end of an uptrend. | Bearish signal | End of an uptrend |
| Dragonfly | Opening and closing prices are at the peak of the day. Long lower wick, no or very short upper wick. Usually indicates a bullish reversal at the end of a downtrend. | Bullish reversal | End of a downtrend |
| Long Legged | Both upper and lower wicks are long, indicating indecision between buyers and sellers. Can occur at the end of both uptrends and downtrends. | Market uncertainty | End of uptrends and downtrends |
| Standard | Short upper and lower wicks with nearly equal opening and closing prices. Indicates indecisiveness in the market and can occur at the end of any trend. | Market indecisiveness | End of any trend |
| Price | Short wicks and a small body, indicating equilibrium between buyers and sellers. Suggests uncertainty and stagnation in the market. | Uncertainty and stagnation | Small price movement range |
| Neutral | Nearly equal-length wicks on both sides, with identical opening and closing prices. Represents perfect balance and market uncertainty. | Market uncertainty | Perfect balance between buyers and sellers |
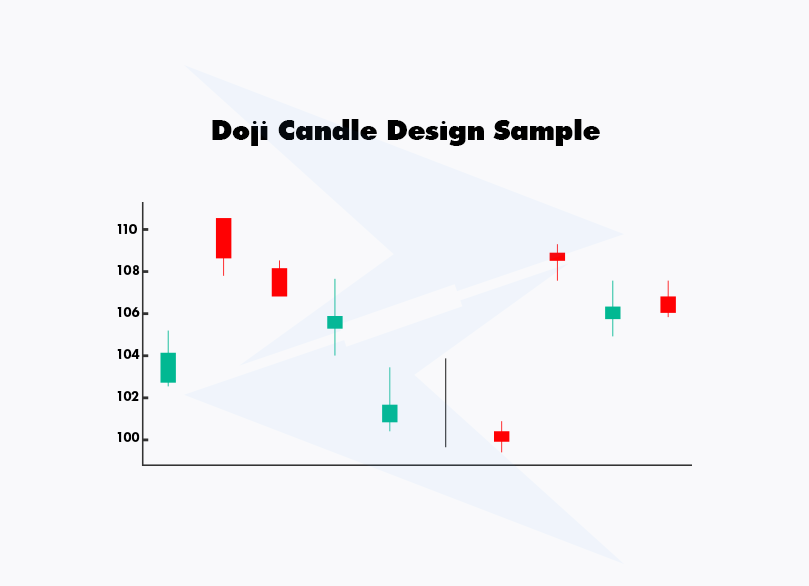
Let's analyze the chart together to understand the Doji pattern:
Does it matter if a Doji is red or green?
In general, the color of a Doji candle (red or green) is not very critical. However, a red one indicates that the closing price is slightly lower than the opening price, showing that sellers have a slight advantage. On the other hand, a green one means the closing price is slightly higher than the opening price, giving buyers a small edge.
How accurate is the Doji pattern in technical analysis?
The Doji pattern can indicate indecision in the market and potential trend changes. However, when used alone, it’s not considered a very strong signal. The accuracy of the Doji depends on the context in which it appears and how it is combined with other technical indicators.
What does 2 Dojis in a row mean?
When two Dojis appear consecutively, it signals significant indecision in the market. It indicates a strong balance between buyers and sellers, with market direction being uncertain. In such a situation, a large movement can be expected, though it’s unclear which direction the market will move.
What does 3 Dojis in a row mean?
Three consecutive Doji candles suggest a strong pause or indecision in the market. This pattern typically signals that a trend has stalled, or that the market is preparing for a large movement. The appearance of this pattern in a row is quite rare, and it is often followed by a strong breakout.
Is a Doji a bullish reversal?
Doji candles are not inherently a bullish or bearish reversal signal. However, if it appears at the end of a downward trend, it can be a potential signal for a bullish reversal. Still, the signal should be confirmed by subsequent candles and other indicators.
What is the difference between a Doji and Spinning Top?
The main difference lies in the size of their bodies. Doji candles have almost identical opening and closing prices, resulting in a very small or nonexistent body. Spinning Tops, on the other hand, have a more noticeable body, meaning there is a slight difference between the opening and closing prices.
Sign up in seconds for free, access your platform, and start trading with ease.
 $200 Oil Scenario: The Chain Reaction Across Markets
What happens if oil hits $200? See the impact on global markets, sectors, inflation, and which industries could win or lose.
Detail Biggest Manipulations in Financial Market History
Financial markets have seen their share of manipulation over the years. Here are seven of the biggest cases in modern history.
Detail Petrodollar System: Why It Still Matters
Energy markets depend on supply routes, currency systems, and trade infrastructure determine prices, inflation, and financial stability across the global economy.
DetailThen Join Our Telegram Channel and Subscribe Our Trading Signals Newsletter for Free!
Join Us On Telegram!


