


The MACD (Moving Average Convergence Divergence) indicator is a useful momentum oscillator that reflects the relationship between two moving averages of an asset's price. The MACD indicator is widely used by traders across different financial markets. It is popular for its ability to identify potential changes in the direction of price momentum.
MACD consists of three main components:
The MACD is useful for traders to see the strength and direction of price momentum in a financial asset. It works by calculating and interpreting the signals and implementing them into your trading strategies. Here's how:
Subtracting the 26-period Exponential Moving Average (EMA) from the 12-period EMA of an asset's price yields the MACD line.
The 12-period EMA responds more quickly to recent price fluctuations, but the 26-period EMA gives a smoother average over a longer period.
Subtracting the longer EMA from the shorter EMA yields a single line that oscillates above and below zero, indicating the convergence and divergence of the two moving averages.
The signal line is the MACD line's 9-period exponential moving average.
It serves as a trigger for buy and sell signals, smoothing out the MACD line's swings.
The histogram is created by plotting the difference between the MACD and signal lines. It gives visual indications about the strength and direction of momentum.
When the MACD line is above the signal line, the histogram turns positive, suggesting bullish momentum. In contrast, when the MACD line is below the signal line, the histogram is negative, suggesting bearish momentum.
Interpreting the signals right can help you benefit from using the MACD indicator. Here's what you need to interpret:
Crossovers: When the MACD line crosses above or below the signal line, it is called a signal line crossover. When the MACD line crosses above the signal line, it is a bullish signal. When it's the other way around, it's a
Zero Line Crossovers: When the MACD line crosses above the zero line, it indicates increased bullish momentum, whilst a cross below the zero line indicates increased bearish momentum.
Divergence: Divergence occurs when the price of an asset moves in the opposite direction of the MACD.
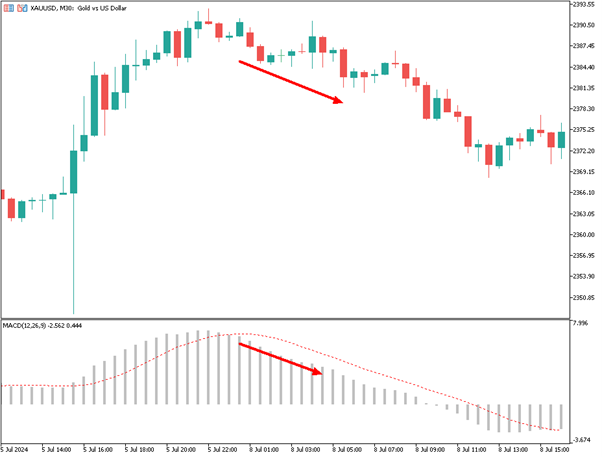
Sell Signal: When the grey bars (MACD Main) cross below the red line (MACD Signal Line), as seen in the chart below, it often signals that the price is starting to fall.
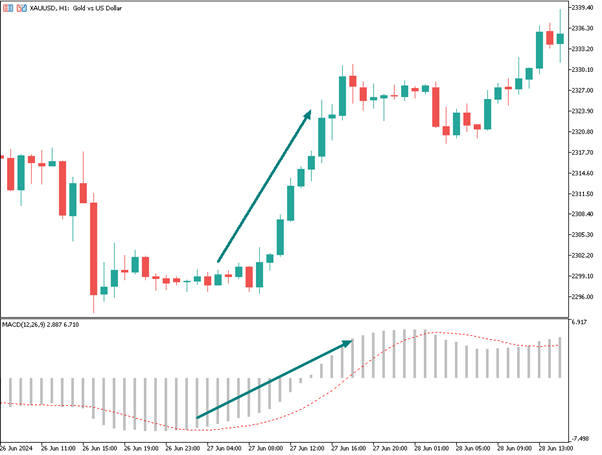
Buy Signal: When the grey bars (MACD Main) cross above the red line (MACD Signal Line), as observed in the chart below, it typically indicates that the price is beginning to rise.
The MACD indicator is used in various trading strategies such as trend following, momentum, and reversal strategies. Traders also use additional technical indicators and price action analysis to confirm MACD signals and minimize false ones.
While the Moving Average Convergence Divergence (MACD) is a widely used tool in technical analysis, it has several limitations that traders should be aware of:
Let's take a look at them in more detail.
Like most moving average-based indicators, the MACD is a lagging indicator, which reacts to past price movements. So, it may not provide immediate signals for fast-moving markets or during high volatility times.
The MACD can generate false signals, especially during choppy or sideways markets. It's possible to experience whipsaws, where the indicator gives conflicting buy and sell signals in quick succession, leading to losses if acted upon impulsively.
Unlike other oscillators (such as the Relative Strength Index or Stochastic Oscillator), the MACD doesn't include overbought or oversold levels. As a result, it may not accurately identify extreme market conditions, leading traders to miss potential reversal points.
The MACD's calculations rely on moving averages, which may not always precisely capture quick or fast price movements. This dependency can lead to inaccuracies in signal generation, particularly in volatile market conditions.
The MACD is influenced by parameters such as the number of periods for the moving averages and the smoothing factor for the signal line. These parameters can affect its effectiveness. Different parameter values can produce varying signals, which makes it more difficult for traders to determine the optimal settings for a market.
Relying entirely on the MACD for trading decisions may result in missing significant market characteristics and increasing the chance of making wrong conclusions. That's why it should be used with other technical indicators, price action analysis, and risk management strategies to have maximum effectiveness.
Comparing the MACD (Moving Average Convergence Divergence) indicator with the RSI (Relative Strength Index) provides insights into their respective strengths, weaknesses, and applications in trading:
MACD (Moving Average Convergence Divergence):
RSI (Relative Strength Index):
We have explained what the MACD indicator is, describing its details, how it works, its limitations, and comparison with RSI (Relative Strength Index). In conclusion, the MACD (Moving Average Convergence Divergence) indicator is a pillar of technical analysis, providing traders with significant insights into market momentum and potential trend reversals.
The MACD is the most effective when used with other technical indicators and risk management strategies. Although it has limitations, using it correctly can help traders navigate financial markets with confidence.
What is a good MACD value?
A good MACD value depends on the context and the timeframe being analyzed. Traders often look for MACD crossovers above the zero line as potential buy signals and below the zero line as potential sell signals.
What are the three numbers in MACD?
The three numbers in MACD represent the parameters used in its calculation:
Which is more accurate RSI or MACD?
RSI and MACD have different purposes. However, if used appropriately in combination with other analysis techniques and confirmation signals, they can both be accurate.
What is a bullish MACD crossover in a stock?
A bullish MACD crossover in a stock occurs when the MACD line crosses above the Signal line, indicating increasing bullish momentum and potentially signaling a buy opportunity.
How does MACD divergence impact stock analysis?
MACD divergence in stock analysis occurs when the price movement of a stock differs from the movement of the MACD.
Sign up in seconds for free, access your platform, and start trading with ease.
 $200 Oil Scenario: The Chain Reaction Across Markets
What happens if oil hits $200? See the impact on global markets, sectors, inflation, and which industries could win or lose.
Detail Biggest Manipulations in Financial Market History
Financial markets have seen their share of manipulation over the years. Here are seven of the biggest cases in modern history.
Detail Petrodollar System: Why It Still Matters
Energy markets depend on supply routes, currency systems, and trade infrastructure determine prices, inflation, and financial stability across the global economy.
DetailThen Join Our Telegram Channel and Subscribe Our Trading Signals Newsletter for Free!
Join Us On Telegram!


