


The Ichimoku Cloud has become an increasingly popular tool among traders. This indicator, unlike traditional technical analysis methods, helps determine the potential future direction of price movements. Frequently used in decision-making processes, this tool allows traders to both follow trends and see support and resistance levels more clearly.
During periods of high uncertainty, the need for a reliable analysis tool grows. This is where the Ichimoku Cloud comes into play, offering investors a broader perspective. Users of this indicator not only focus on current price movements but also consider the overall market outlook and potential trend reversals, allowing them to make more informed decisions.
Developed by Japanese analyst Goichi Hosoda, the Ichimoku Cloud is a versatile technical analysis tool that provides the ability to evaluate market trends, support and resistance levels, momentum, and potential trend reversals all at once.
Although it is a more complex tool compared to other technical indicators, when used correctly, it can generate very strong signals. It allows traders to analyze price movements from different angles through its various components on the chart. With these components, investors can not only assess the current market situation but also take potential future trend reversals into account.
The primary purpose of this indicator is to provide a clearer forecast of the price’s direction and give investors clues as to whether the market will remain in its current trend. In this way, traders can have a broader perspective on the overall market condition.
The Ichimoku Cloud consists of five main components, each calculated using averages of different time periods:
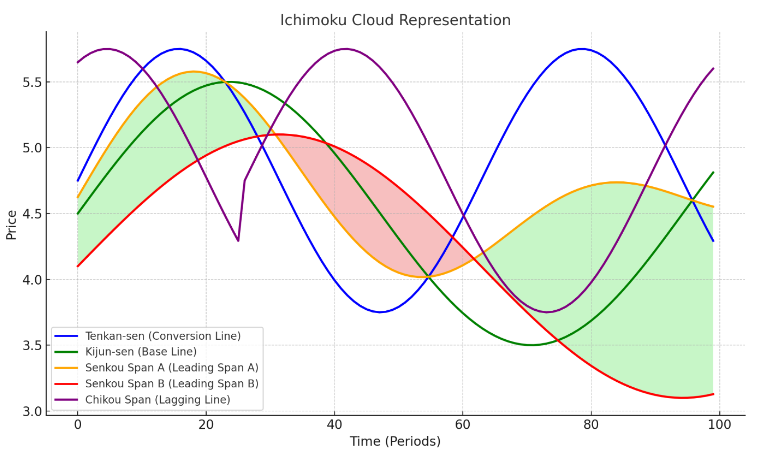
In the chart, we see the 5 main elements in different colors. Let's take a closer look at what they represent:
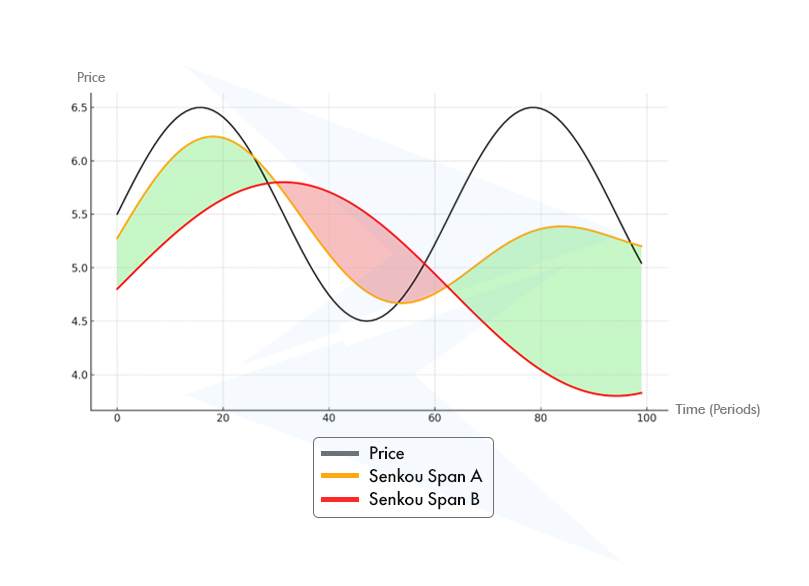
The most prominent part of the Ichimoku Cloud is the area known as the "cloud" (Kumo). The cloud is formed by the difference between two leading lines, Senkou Span A and Senkou Span B.
If prices are above the cloud, the market is considered to be in an upward trend. If prices are below the cloud, it indicates a downward trend. The thickness of the cloud provides information about the strength of the trend; thick clouds indicate a strong trend, while thin clouds suggest a weaker trend.
The cloud also acts as a dynamic support and resistance zone. When prices break above the cloud, the cloud serves as support. When prices fall below the cloud, the cloud acts as resistance. This helps traders identify key levels in the market.
However, the cloud is not the only element to observe. The interaction between Tenkan-sen and Kijun-sen also provides important signals.
The crossovers of the short-term Tenkan-sen and the medium-term Kijun-sen can signal potential buy or sell opportunities. When Tenkan-sen crosses above Kijun-sen, this is seen as a buy signal, whereas when Tenkan-sen falls below Kijun-sen, it is considered a sell signal.
Chikou Span allows the comparison of current price movements with past ones. If Chikou Span is above the current price, the market has upward momentum. If Chikou Span is below the price, the market is showing downward momentum.
The Ichimoku Cloud provides traders with important insights into market trends, momentum, and support/resistance levels. By using this indicator, traders can gain a better understanding of current market conditions and make predictions about potential future price movements.
In the table below, you can see a clearer representation of the information the Ichimoku Cloud offers to traders:
| Element | Description | Market Indication |
| Cloud (Kumo) | The cloud formed by the difference between Senkou Span A and B. Prices above the cloud indicate an upward trend, and below the cloud indicate a downward trend. | Thick clouds indicate a strong trend, thin clouds indicate a weak trend. Acts as dynamic support/resistance. |
| Tenkan-sen | Short-term trend indicator calculated by averaging the highest high and lowest low of the last 9 periods. Signals potential buy when it crosses above Kijun-sen. | Provides short-term market trends. When it crosses above Kijun-sen, it's a buy signal; when it crosses below, it's a sell signal. |
| Kijun-sen | Medium-term trend indicator calculated by averaging the highest high and lowest low of the last 26 periods. Provides key signals when crossed by Tenkan-sen. | Serves as a medium-term market trend. Provides signals when crossed by Tenkan-sen for potential buy or sell opportunities. |
| Senkou Span A | Calculated by averaging Tenkan-sen and Kijun-sen, plotted 26 periods ahead. Forms the upper boundary of the cloud. | Forms part of the cloud and gives forward-looking insights into market direction. |
| Senkou Span B | Calculated by averaging the highest high and lowest low of the last 52 periods, plotted 26 periods ahead. Forms the lower boundary of the cloud. | Forms the lower part of the cloud and helps to indicate future support or resistance levels. |
| Chikou Span | Current closing price plotted 26 periods back, allows the comparison of current price movements with past ones. | Shows whether current momentum is upward or downward by comparing with past price levels. |
The Ichimoku Cloud is a versatile indicator that helps traders both track trends and identify potential buy and sell opportunities. The various components of this indicator can be effectively used to understand the overall market outlook and take the right positions.
In this section, we will explore how to use the Ichimoku Cloud for trading, with example charts and different strategies.
First, let's take a look at how we can use the Ichimoku Cloud for trend following. In this method, the position and thickness of the cloud provide important clues about the overall direction of the market.
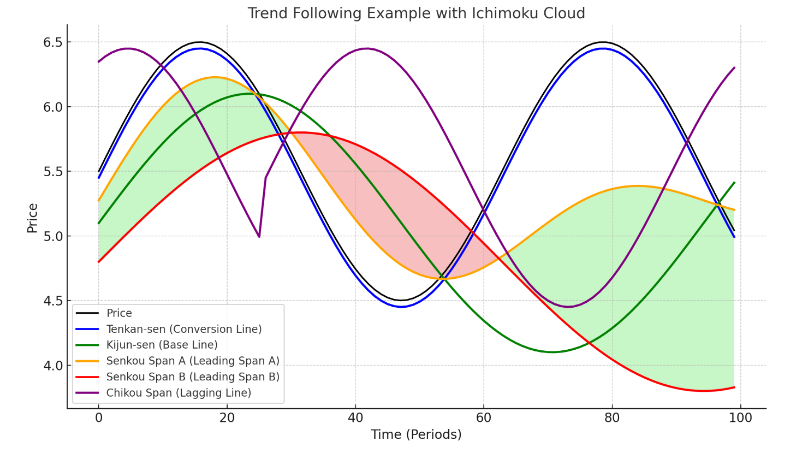
In the chart, we see price movements along with the components of the Ichimoku Cloud:
In buy and sell signals, the crossovers of Tenkan-sen and Kijun-sen play an important role:
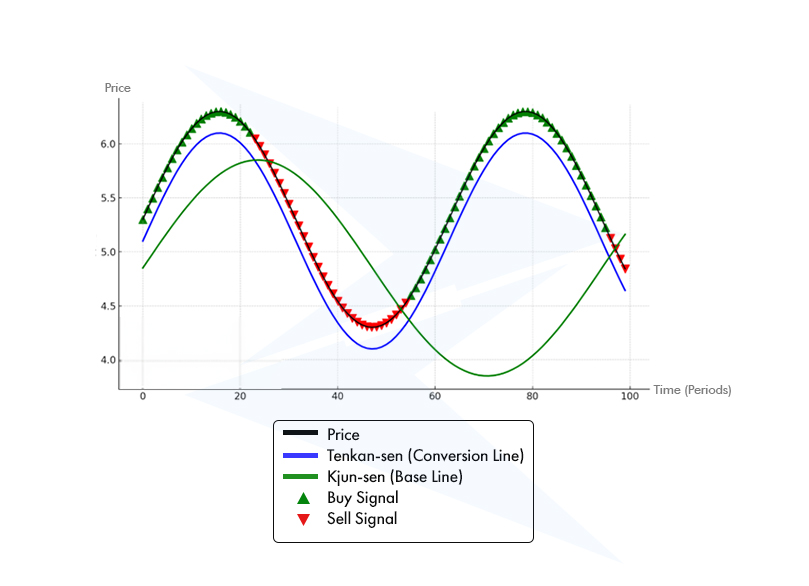
In the chart, we see buy and sell signals generated by the crossovers of Tenkan-sen and Kijun-sen:
The Ichimoku Cloud stands out for its use as a dynamic support and resistance level. When prices break above the cloud, the cloud acts as support, while when prices remain below the cloud, it functions as resistance.
In the chart, we can observe the price movements and how the Ichimoku Cloud functions as support and resistance levels:
The Chikou Span component of the Ichimoku Cloud is used for tracking momentum. This strategy can be applied to understand whether the market's momentum is upward or downward.

We can see the Chikou Span (purple line) and the price movements in the chart:
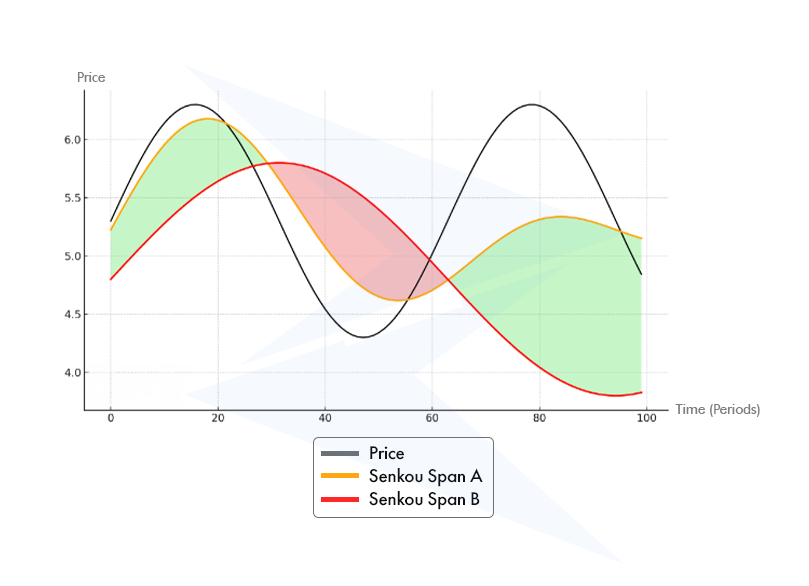
Another strength of the Ichimoku Cloud is its ability to help predict how trends might shape up in the future. Since Senkou Span A and Senkou Span B are plotted forward, they provide projections about the future direction of the market.
The Ichimoku Cloud allows you to gain a broader perspective on the overall market condition by analyzing different time frames. Using this strategy, you can analyze short, medium, and long-term trends simultaneously.
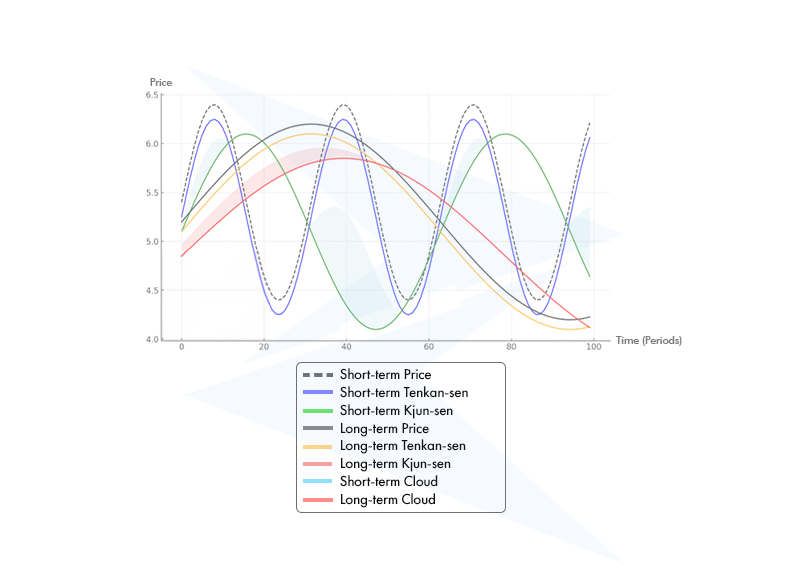
In the chart, we can see both short-term and long-term price movements along with the components of the Ichimoku Cloud. This strategy combines market analysis across multiple time frames to support investment decisions:
The Ichimoku Cloud consists of many components, making it complex and difficult for new traders to understand.
The Ichimoku Cloud provides a more comprehensive analysis to predict future price movements while moving averages have a simpler structure and are typically used for trend-following and identifying support/resistance levels.
You can see the differences between the two indicators more clearly in the table below:
| Ichimoku Cloud | Moving Averages |
| Multiple components (Tenkan-sen, Kijun-sen, Senkou Span A & B, Chikou Span) | Single line (SMA, EMA, etc.) |
| Complex, involves multiple calculations | Simple, easy to calculate and understand |
| Yes, forward projection with Senkou Span A and B | No forward projection |
| Effective for identifying medium and long-term trends | Effective for identifying general trends but can lag |
| Dynamic support and resistance levels with the cloud | Support and resistance are defined by the moving average line |
| Based on crossovers of Tenkan-sen and Kijun-sen, and price interaction with the cloud | Based on crossovers of short-term and long-term moving averages |
| Trending markets, volatile environments | Any market, especially helpful in trend-following strategies |
What is the best time frame for the Ichimoku Cloud indicator?
The best time frame for the Ichimoku Cloud indicator depends on the trader’s strategy. However, since it is typically used to track medium- and long-term trends, daily and weekly time frames are the most effective. These time frames allow for the effective use of all the indicator's components and provide a better analysis of long-term trends.
Which other technical indicators work best with the Ichimoku strategy?
The best technical indicators to use alongside the Ichimoku strategy include Moving Averages (MA), the Relative Strength Index (RSI), and volume indicators. These indicators can confirm the signals given by Ichimoku and add more confidence to buy/sell points. For example, RSI can be used to identify overbought or oversold conditions, which can confirm Ichimoku’s buy or sell signals.
What does Ichimoku mean in English?
"Ichimoku" is a Japanese word that translates to "at a glance" in English. This name reflects the indicator's ability to quickly provide information about the overall market condition. Traders can obtain insights about price direction, momentum, and potential support/resistance levels at a glance.
Can Ichimoku Cloud be used for scalping?
It is possible to use the Ichimoku Cloud for scalping, but the indicator is mainly designed for tracking medium- and long-term trends. Still, you can use the Ichimoku Cloud's components for scalping on shorter time frames (e.g., 5-minute or 15-minute charts). You can particularly focus on the crossovers of Tenkan-sen and Kijun-sen, price interactions with the cloud, and the position of Chikou Span for short-term trades. However, it's important to be cautious about the indicator’s natural lag in scalping, as this can make quick decision-making more difficult.
Sign up in seconds for free, access your platform, and start trading with ease.
 $200 Oil Scenario: The Chain Reaction Across Markets
What happens if oil hits $200? See the impact on global markets, sectors, inflation, and which industries could win or lose.
Detail Biggest Manipulations in Financial Market History
Financial markets have seen their share of manipulation over the years. Here are seven of the biggest cases in modern history.
Detail Petrodollar System: Why It Still Matters
Energy markets depend on supply routes, currency systems, and trade infrastructure determine prices, inflation, and financial stability across the global economy.
DetailThen Join Our Telegram Channel and Subscribe Our Trading Signals Newsletter for Free!
Join Us On Telegram!


