


Breakout strategies are used across all markets and work on various timeframes, from intraday scalping to long-term swing trading. The key is identifying potential breakout zones before the move happens and having a plan in place for entry, exit, and risk control. Let’s learn more about them!
Breakout strategies are based on the idea that when price breaks a key level, like support, resistance, or a pattern boundary, it often continues in that direction with momentum.
Before a breakout happens, the price usually consolidates in a tight range. This shows indecision in the market, like a buildup of pressure. Once the price breaks out of this zone, it often triggers stop orders and attracts new traders, creating a strong move.
There are three key phases in a breakout:
This strategy works because it aligns with market psychology; once a level is broken, it signals that buyers or sellers have taken control, and others rush to join the move.
To successfully trade breakouts, traders need tools that help them identify key price levels, gauge volatility, and confirm momentum. Below are the most common tools and how they are used within breakout strategies:
Traders can better filter high-probability breakouts from false signals by combining these tools. For example, a price breaking out of resistance with high volume and rising RSI is more convincing than a breakout on low volume with no momentum confirmation.
A well-executed breakout strategy starts with a clear entry plan. The most effective breakout trades are performed when the price pushes through a significant support or resistance level with conviction, ideally supported by rising volume and clean price action. Entering a breakout too early can lead to getting trapped in a false move, while entering too late might mean reduced profit potential and increased risk.
To confirm a breakout before entering a trade, traders often look for:
Depending on your risk appetite, you can enter aggressively (immediately after the breakout) or conservatively (after the retest and confirmation). Both styles are valid; what matters is consistency and proper risk control.
When it comes to stop-loss placement, the goal is to protect your position without getting knocked out by normal market noise.
Common stop-loss techniques include:
Exits should be just as deliberate as entries. Some traders use fixed take-profit levels based on prior ranges or chart patterns. Others prefer to trail their stops behind the price to lock in gains while allowing the trend to develop.
Effective exit options:
Breakout trades work best when approached with patience and precision. It’s not about reacting to every spike, it’s about waiting for the right setup and executing it with confidence, knowing exactly where you’ll enter, exit, and protect yourself.
Not all breakouts are worth trading. Many are short-lived fakeouts that trap traders and reverse sharply. The key is to focus only on high-probability setups, those that show clear signs of pressure building and momentum ready to explode.
High-probability breakout setups often share these characteristics:
When multiple signs align like a tight range, low volatility, and a strong level, it often signals that a breakout is not only possible but likely to follow through. Patience is essential here. Let the setup develop, and don’t force entries just because “something might happen.”
It’s also wise to analyze the context: Is the market trending or range-bound? Are we near a key session open (like London or New York)? Are there upcoming news events that might trigger the move? The more context you have, the better decisions you will make.
Breakout trading carries high potential, but also high risk. Without solid risk management, even the best setups can lead to quick losses, especially during false breakouts.
To manage risk effectively:
In breakout trading, surviving the bad trades is what keeps you around long enough to catch the great ones.
Examples here will help you get a better understanding of the breakout strategy in certain scenarios.
This system focuses on the breakout of the previous day's high or low, with trades initiated upon a confirmed close beyond these levels.
Implementation Steps:
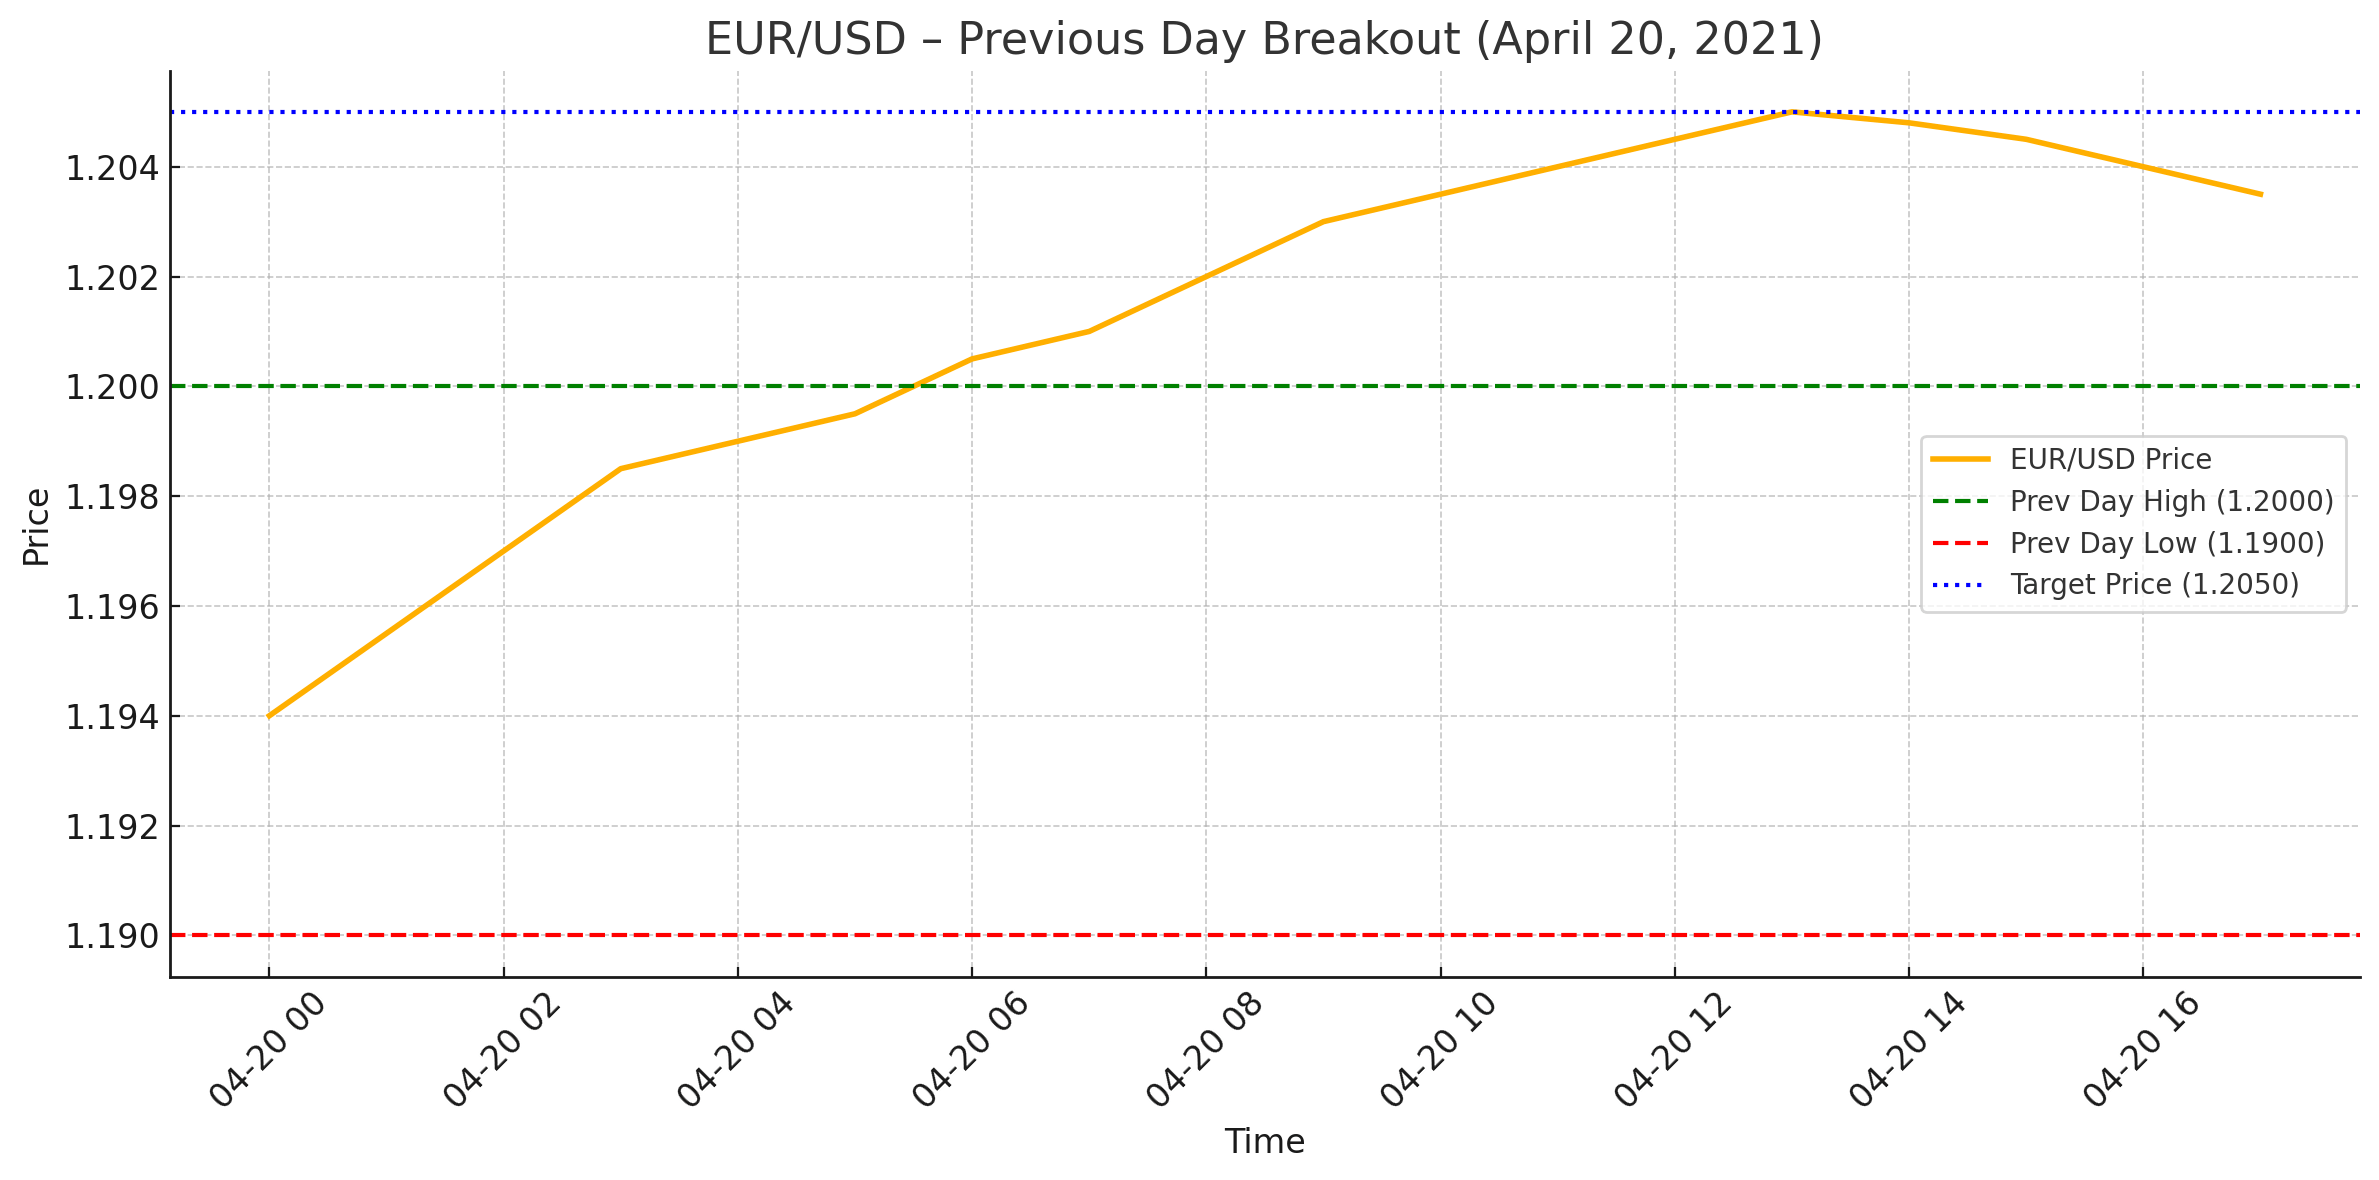
Example: EUR/USD
On April 20, 2021, EUR/USD's previous day high was 1.2000, and the low was 1.1900. During the trading session, the price closed above 1.2000, prompting a long entry at the open of the next hourly candle. The price then ascended to 1.2050, achieving a 50-pip gain.
This strategy involves identifying specific time-based ranges within the trading day and placing buy and sell orders at the boundaries of these ranges. The primary goal is to capture breakouts from these ranges, with predefined take profit (TP) and stop loss (SL) levels.
Implementation Steps:
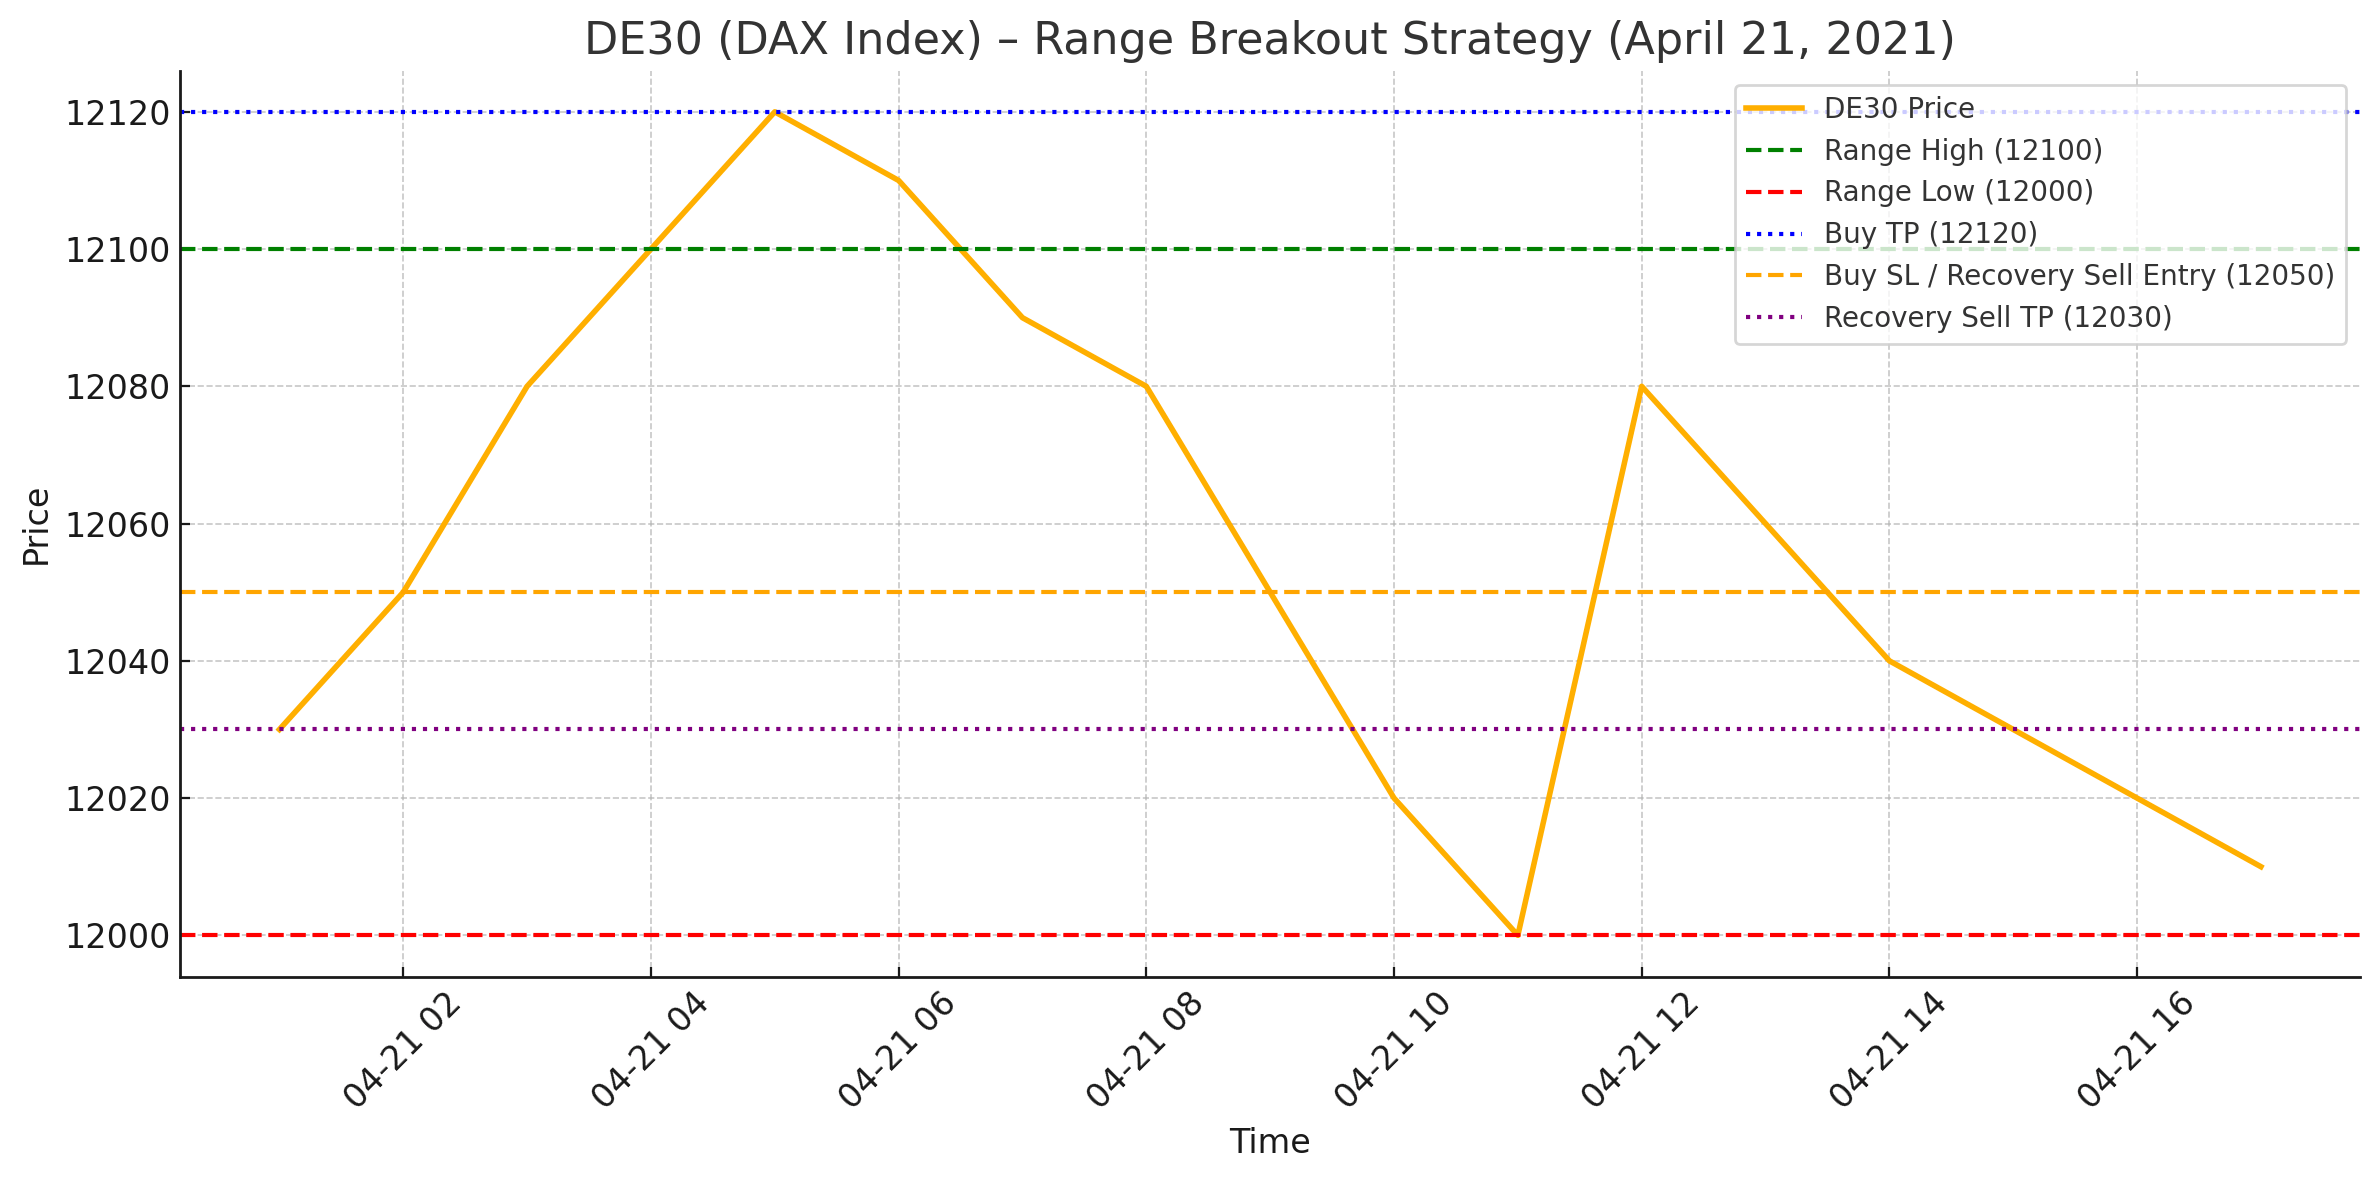
Example: DAX Index
On a particular trading day, the DAX index established a range between 12,000 and 12,100 points during the specified timeframe. A buy order was placed at 12,100, and a sell order at 12,000. The price broke above 12,100, reaching 12,120, triggering the buy order and achieving the 20-pip TP. Later, the price reversed, hitting the SL. A recovery sell order was then placed at 12,080 (the initial SL level), which subsequently reached its 50-pip TP as the price declined to 12,030
This weekly strategy involves identifying the range of the first 4-hour candle of the week and placing trades based on breakouts from this range.
Implementation Steps:
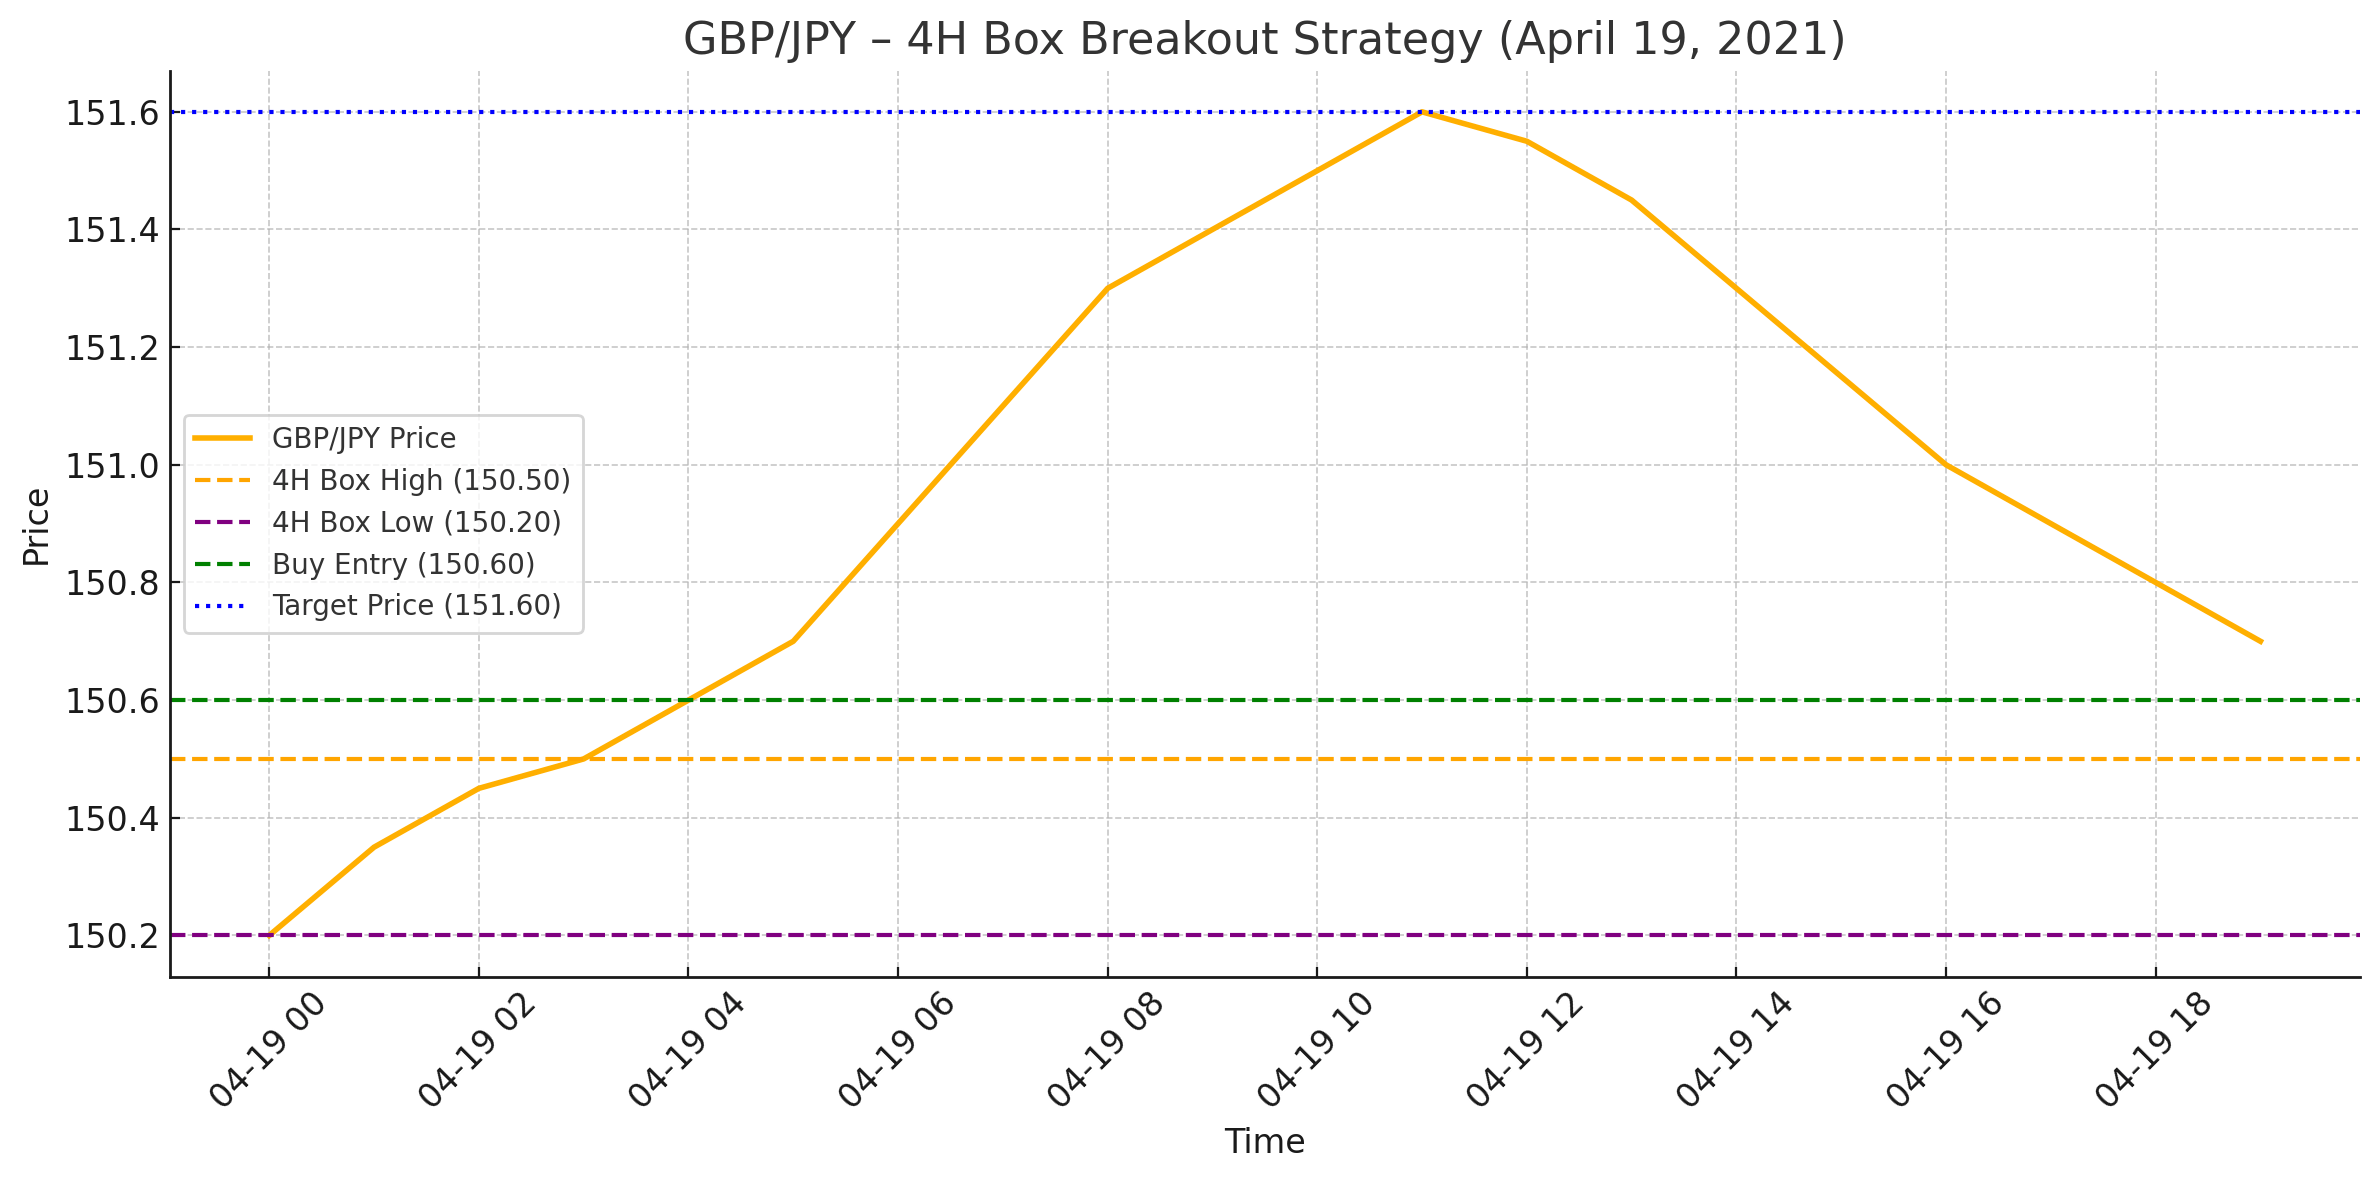
Example: GBP/JPY
At the start of a trading week, GBP/JPY's first 4-hour candle ranged between 150.00 and 150.50. With a 10-pip buffer, a buy order was placed at 150.60 and a sell order at 149.90. The price broke above 150.60, reaching 151.60, achieving a 100-pip gain, equivalent to 2x the box size.
Breakout trading is popular for a reason, it offers traders the chance to catch strong, fast moves right as momentum kicks in. For those who wait patiently and act decisively, it can be a powerful and structured approach.
Key advantages include:
This strategy is especially attractive to traders who prefer structure, speed, and the thrill of catching a market move early, without needing to predict market direction in advance.
Despite its appeal, breakout trading has downsides that can quickly eat into profits if not managed well. The market doesn’t always break and run, sometimes it breaks, fakes, and reverses.
Main limitations include:
Breakout trading is not a get-rich-quick approach. It demands focus, timing, and emotional control. When combined with smart risk management, however, it can be one of the most rewarding methods in a trader’s strategy.
Breakout trading isn’t just about spotting a level and jumping in, it’s about timing, confirmation, and discipline. One of the biggest mistakes new traders make is entering as soon as the price touches a key level. A proper breakout often needs a solid candle close, strong volume or a clean retest.
Not every setup is worth taking. Breakout trading requires patience. Some of the best setups come after long periods of quiet, and forcing trades during low volatility or unclear conditions leads to losses over time.
Here are some additional tips to trade breakouts more effectively:
Conclusion
Breakout trading offers a structured way to catch strong market moves at the moment momentum begins. While the strategy can be powerful, success depends on more than just spotting levels, it requires patience, confirmation, risk management, and emotional control. By focusing on high-probability setups and sticking to clear rules, traders can avoid the noise and take advantage of the opportunities in the market.
Sign up in seconds for free, access your platform, and start trading with ease.
 $200 Oil Scenario: The Chain Reaction Across Markets
What happens if oil hits $200? See the impact on global markets, sectors, inflation, and which industries could win or lose.
Detail Biggest Manipulations in Financial Market History
Financial markets have seen their share of manipulation over the years. Here are seven of the biggest cases in modern history.
Detail Petrodollar System: Why It Still Matters
Energy markets depend on supply routes, currency systems, and trade infrastructure determine prices, inflation, and financial stability across the global economy.
DetailThen Join Our Telegram Channel and Subscribe Our Trading Signals Newsletter for Free!
Join Us On Telegram!


