



The financial markets in 2024 have been nothing short of a rollercoaster ride, shaped by central bank policies, geopolitical dramas, the United States presidential elections, and sector-driven trends.
Major currencies danced to the tune of interest rate changes, metals mirrored global economic jitters, and energy CFDs soared amid supply concerns. Cryptocurrencies started as unpredictable but have shown a remarkable uptrend since September. Indices mirrored broader market trends, shaped by technological advancements.
Ready to dive in? Let’s explore the year-to-date performance of these key markets as of December 23, 2024, and see what made this year one to remember.
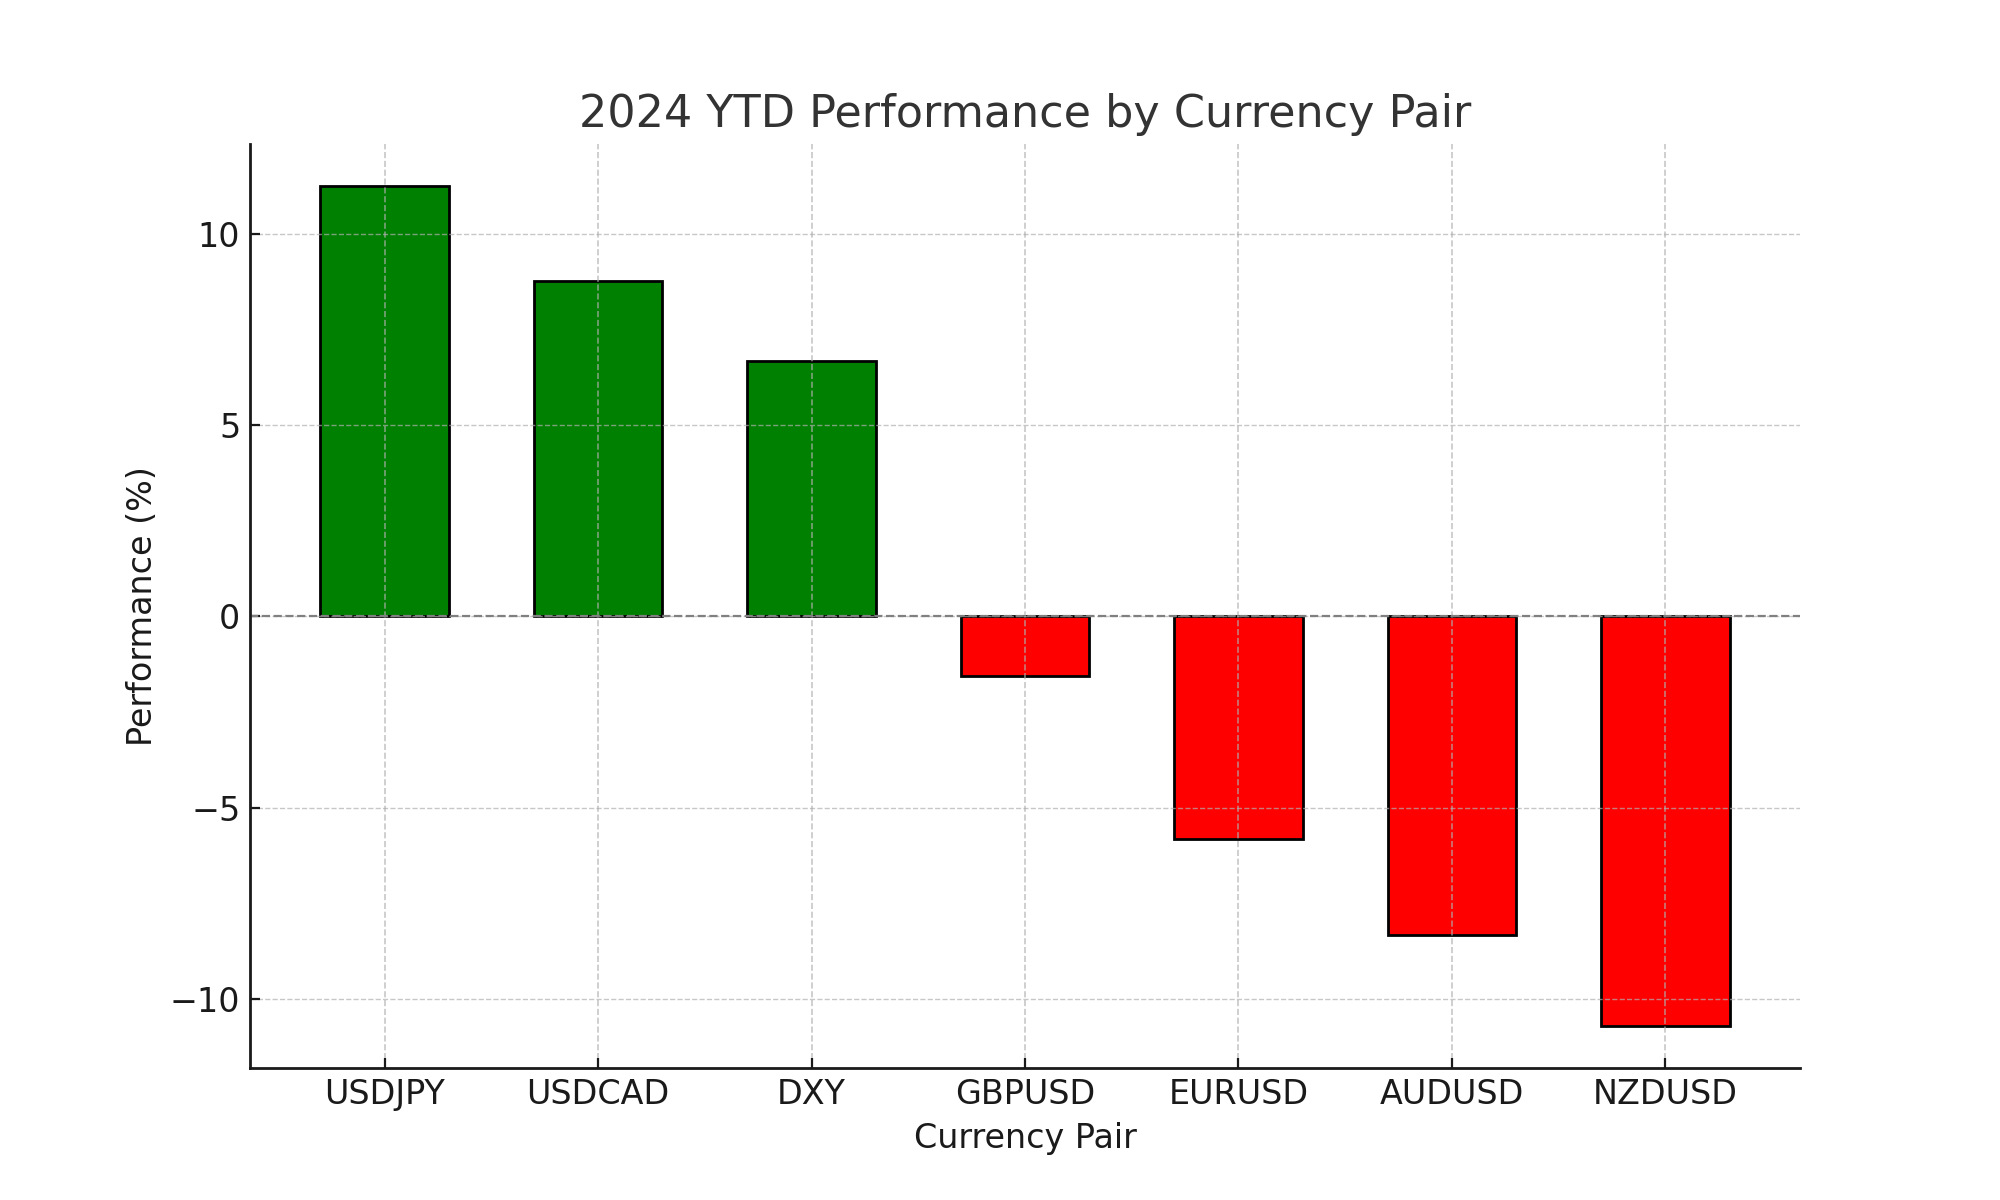
The foreign exchange market in 2024 was dominated by the U.S. dollar, as reflected in the year-to-date performance of various currency pairs.
| Currency Pair | 2024 YTD Change (%) |
| USD/JPY | 11.25% |
| USD/CAD | 8.76% |
| DXY (Dollar Index) | 6.68% |
| GBP/USD | -1.57% |
| EUR/USD | -5.81% |
| AUD/USD | -8.33% |
| NZD/USD | -10.71% |
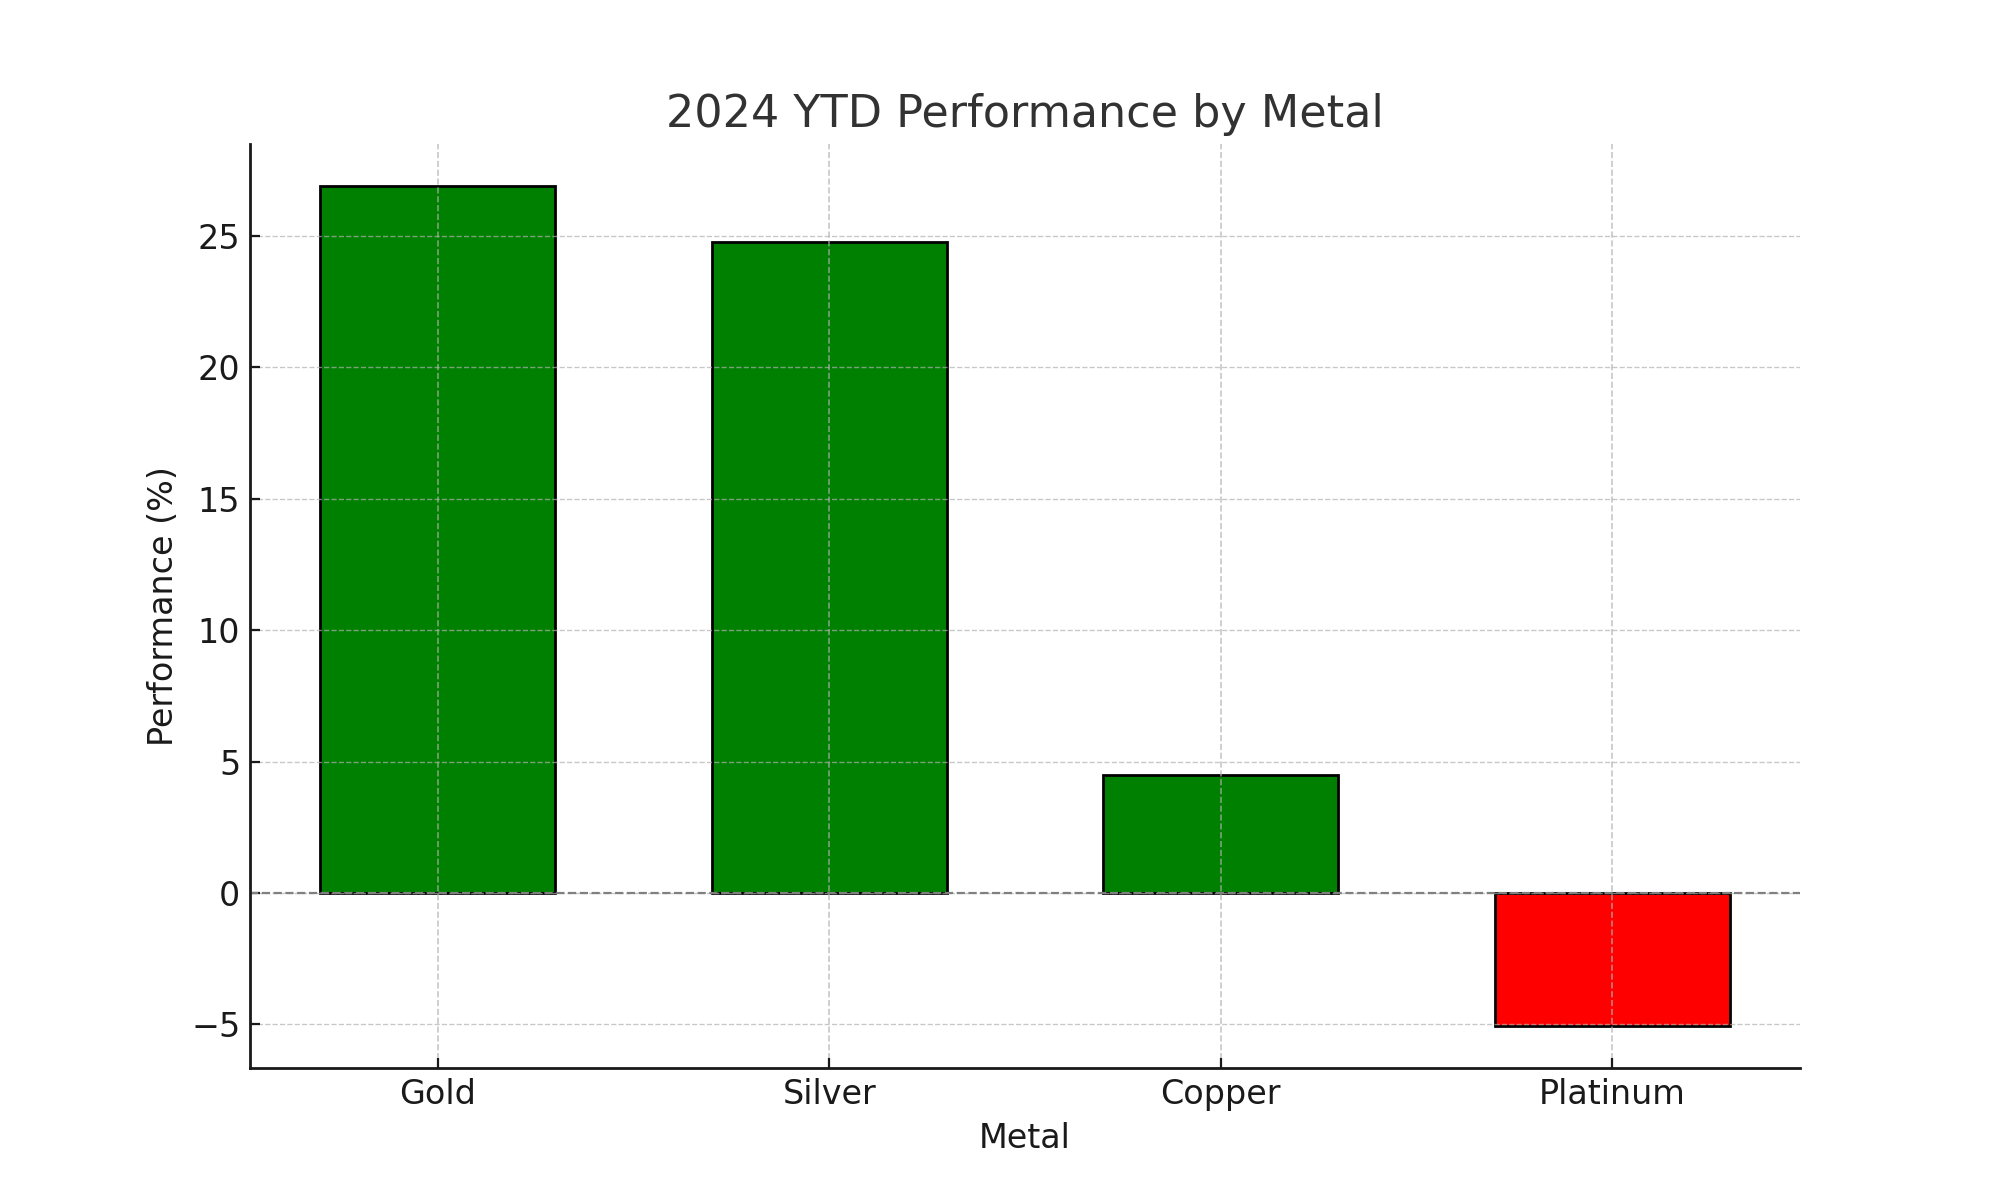
Precious metals showed positive trends in 2024, supported by Federal Reserve rate cuts and geopolitical tensions.
| Metal | 2024 YTD Change (%) |
| Gold | 26.89% |
| Silver | 24.75% |
| Copper | 4.48% |
| Platinum | -5.06% |
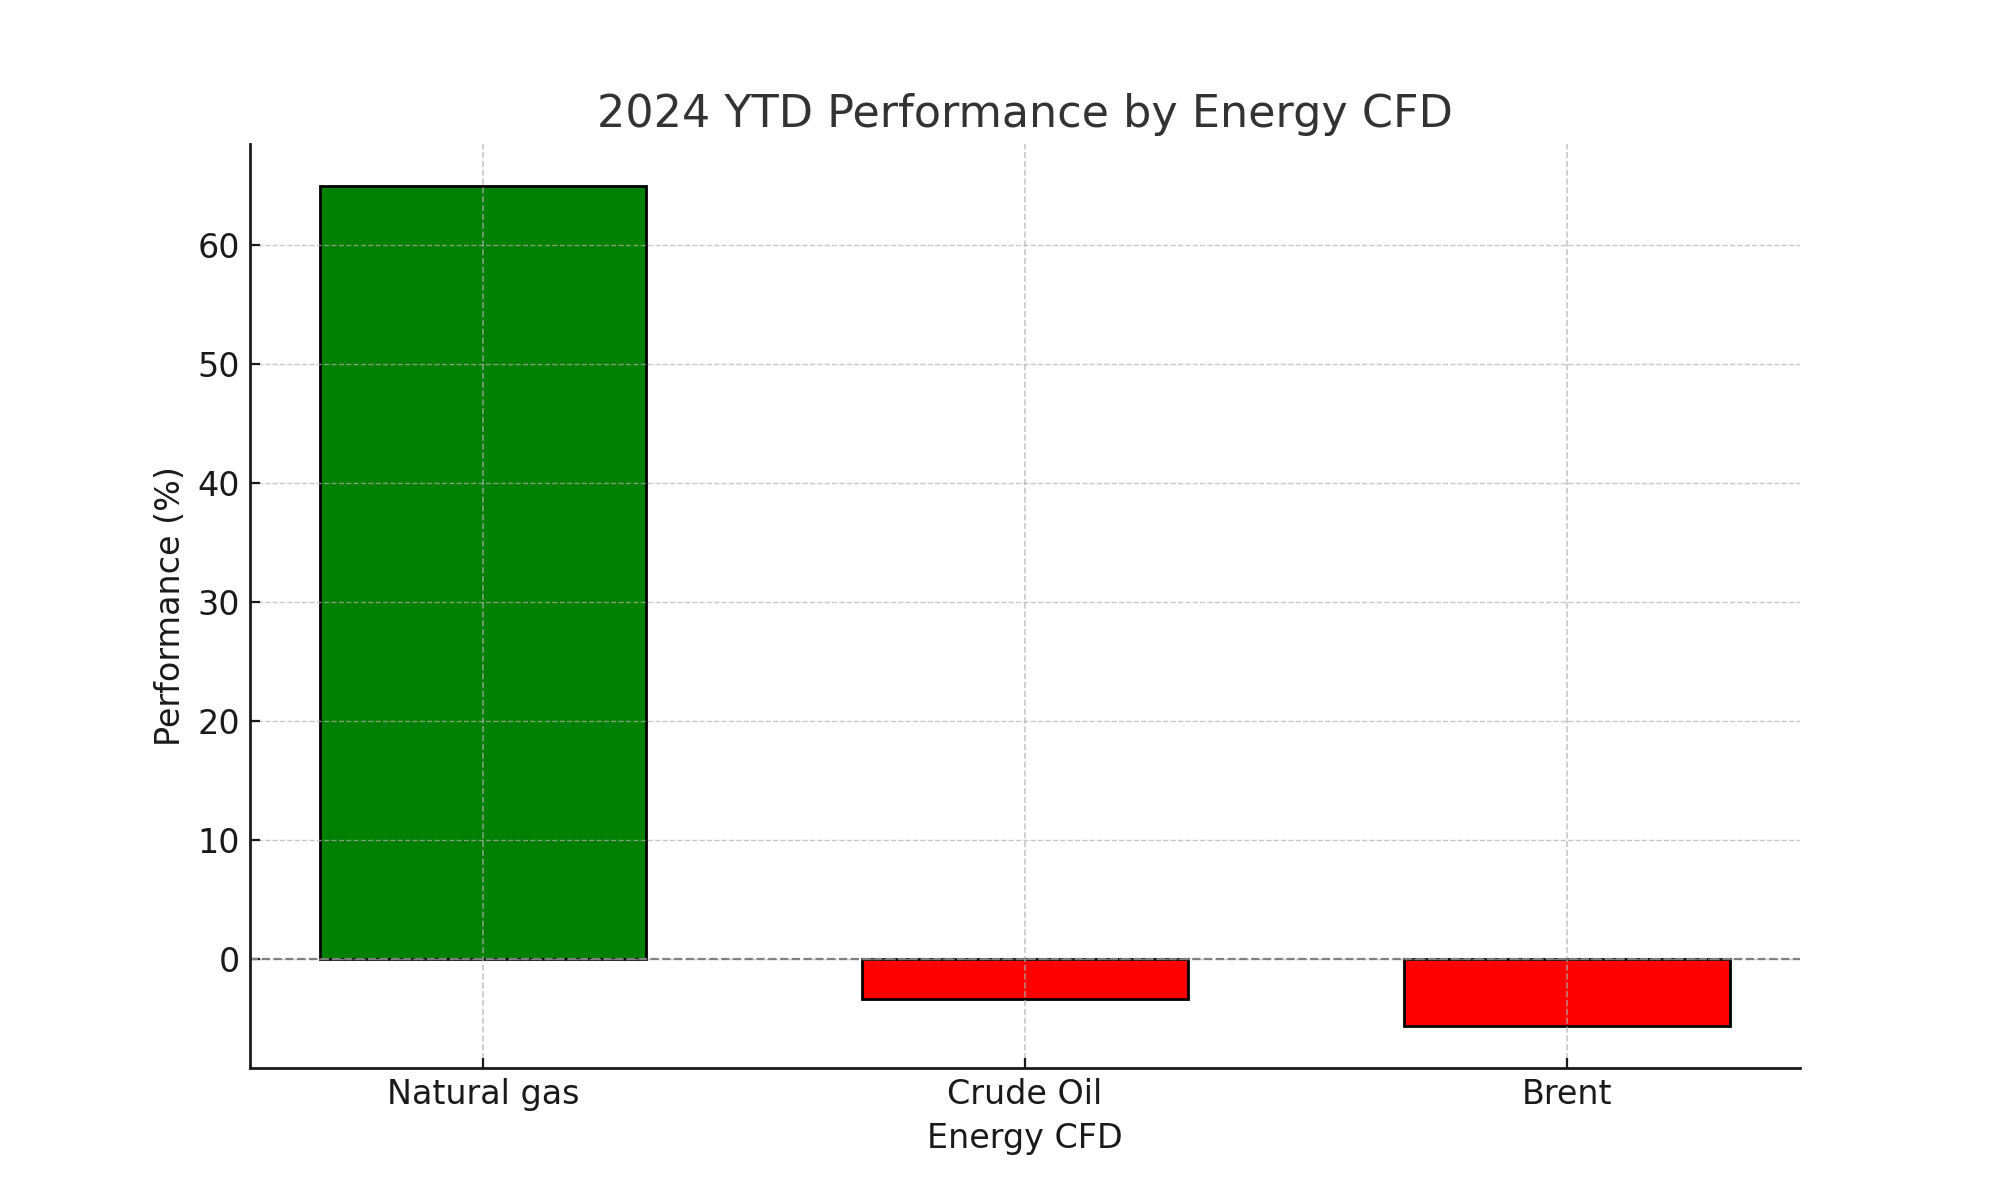
Natural gas saw a significant rally, while crude oil and Brent crude ended the year in negative territory.
| Energy CFD | 2024 YTD Change (%) |
| Natural Gas | 64.95% |
| Crude Oil | -3.34% |
| Brent Crude | -5.62% |
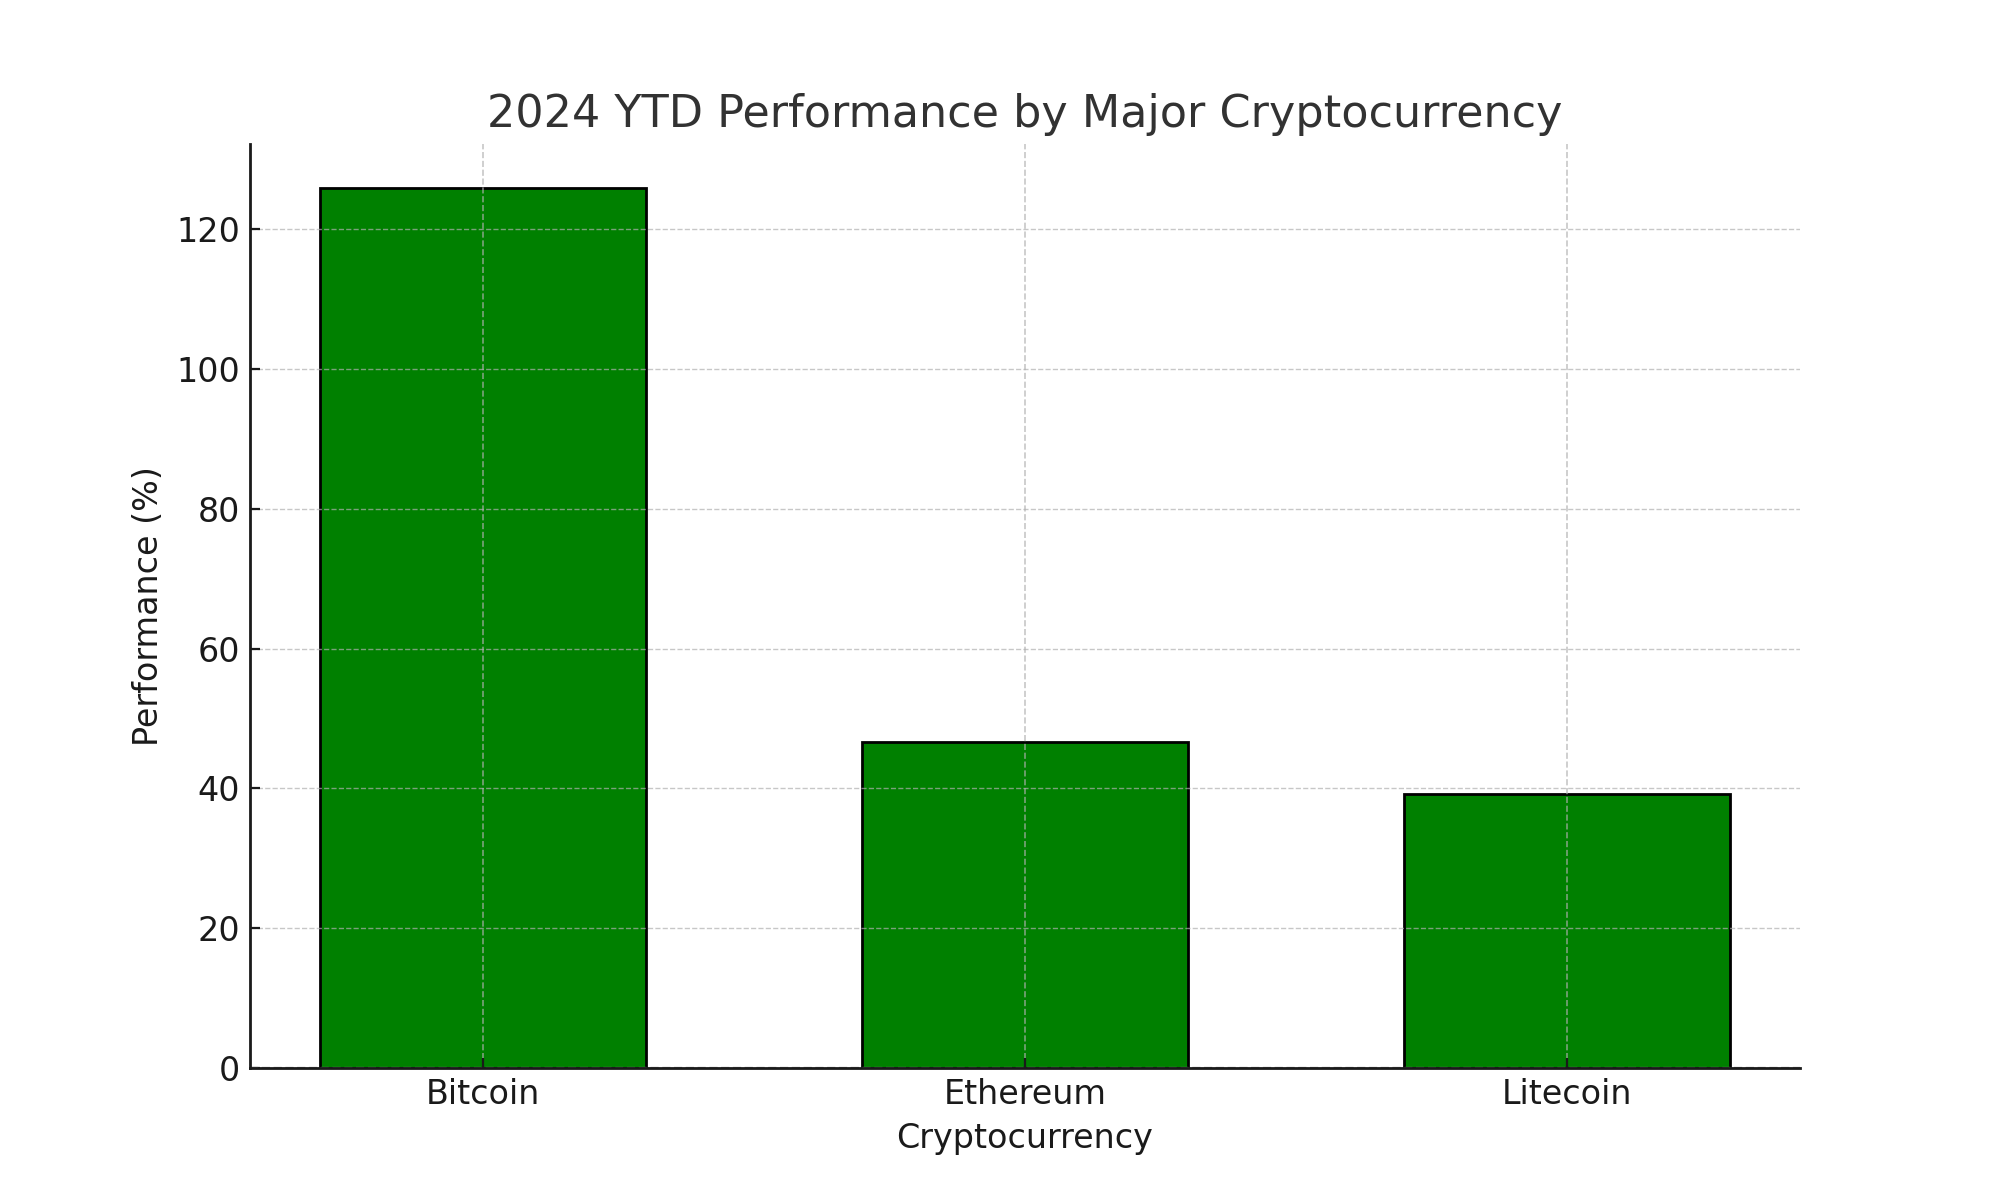
The cryptocurrency market thrived in 2024, buoyed by monetary policy easing and political developments.
| Cryptocurrency | 2024 YTD Change (%) |
| Bitcoin | 125.93% |
| Ether | 46.61% |
| Litecoin | 39.22% |
The Federal Reserve's easing measures and expectations of Donald Trump’s presidency contributed to the rally across major cryptocurrencies.

Global indices saw strong performance overall, driven by central bank interest rate cuts.
| Index | 2024 YTD Change (%) |
| US100 | 26.61% |
| US500 | 24.21% |
| DE40 | 18.59% |
| US30 | 13.21% |
| UK100 | 4.75% |
Sign up in seconds for free, access your platform, and start trading with ease.

 PAMM vs MAM vs Copy Trading: Key Differences
With PAMM, money participates in a managed pool. MAM keeps client accounts separate but gives the manager a central way to trade them. Copy Trading leaves the follower with an independent account and reproduces another trader’s positions there.
Detail What Happens When a Company Joins or Leaves the S&P 500?
How companies join or leave the S&P 500, what happens before and after the change, and the key announcement and effective dates that matter.
Detail What Is PAMM and How Does It Work?
Learn how PAMM accounts work, how profits, losses and manager fees are calculated, and what to check before allocating funds to a trading strategy.
DetailThen Join Our Telegram Channel and Subscribe Our Trading Signals Newsletter for Free!
Join Us On Telegram!


