


Volume is the number of times an asset is bought and sold within a specific time frame. Traders analyze trading volume to assess market activity, interest levels, and the strength of price movements.
Volume is an important data point in determining whether market participants are actively engaged and in confirming the strength of a trend. High volume indicates that buying and selling activity is increasing, signaling strong price movement, while low volume typically points to reduced interest and weaker price movements.
Volume is also an effective indicator in identifying the continuity of trends or the likelihood of reversals. For instance, if trading volume increases during an uptrend, it is seen as a sign of the trend's strength. However, if volume decreases during an uptrend, it is usually interpreted as a sign that the trend is weakening.
In our article, you can learn more details about volume in trading.
Trading volume shows how much of an asset has been bought and sold within a specific time period. High volume typically indicates strong market movement and that traders are actively taking positions. This is often seen at the beginning of a new trend or when a key price level is broken, providing confidence that the trend will continue.
On the other hand, low volume usually occurs during quieter market periods when traders are making fewer transactions. Low-volume price movements are generally considered temporary or unreliable signals, making trading in a low-volume market riskier.
The calculation of volume is based on the total number of buy and sell transactions that occur over a specific period. It is usually automatically recorded by exchanges, and investors can easily view this data on charts or trading platforms.
Volume data can be provided in different time intervals such as daily, weekly, or minute-by-minute. This allows traders to analyze how volume changes over a specific period.
Volume is not limited to a single transaction or position; every buy and sell transaction in the market increases the volume. For example, when an investor buys or sells a particular stock, this transaction increases the market volume, and this data is reflected in charts.
Volume is an indicator that provides important insights into an asset's price movements and market dynamics. Since volume shows how much of an asset is being bought and sold, it helps gauge the level of interest and the strength of that interest among market participants.
For example, if the price of an asset breaks through a key resistance level and volume increases as well, this suggests that the upward movement is strong and likely to be sustained. High-volume price movements can indicate that a trend will continue or that a new trend is starting.
If it is low during price movements, it may signal that the price is not showing a sustainable directional move, and a pullback is more likely. Low-volume price movements are generally considered unreliable, and investors should be more cautious in such environments.
Additionally, volume can signal trend reversals and price corrections. For instance, if it decreases during an uptrend, it indicates that the trend is weakening and a pullback or correction may be approaching. Similarly, rising volume during a downtrend shows that sellers are dominating, and the trend is likely to continue.
When an asset's price rises and trading volume increases as well, it indicates that buyers are dominant in the market and the trend is strong. In this case, investors feel more confident that the trend will continue and prefer to maintain their positions.
If volume remains consistently high during a bull market, this suggests that new buyers are entering the market and the price may continue to rise. An increase in volume, especially at resistance levels being broken, is considered a confirmation signal that the breakout is valid and strong.
However, if volume decreases during an uptrend, it usually indicates that the trend is weakening and buyer interest is fading. This increases the likelihood of the trend ending and suggests that a pullback or correction in price may occur.
The market is dominated by sellers and there is significant selling pressure when an asset's price is declining and trading volume is rising. This may indicate that the trend will likely continue, as traders frequently keep their short positions open.
During a bear market, high volume indicates that sellers are powerful and that the market is still under pressure to decline. A rise in volume is seen as an indication that the decrease is legitimate, particularly when a significant support level is breached.
On the other hand, if it declines as the price drops, it may indicate a decline in seller interest and an easing of selling pressure. Investors may use greater caution in this situation, taking into account the likelihood that the trend could be coming to an end.
Volume plays a role in understanding the accuracy and strength of an asset's price movements. For example, if a stock's price breaks through a key resistance level and volume increases during this breakout, traders may perceive this movement as strong and valid. In this case, the increase in volume is considered a sign that the upward trend is likely to continue.
Another example could be an asset in a downtrend. If the price breaks through a key support level while volume also increases, it indicates that the breakdown occurred with strong selling pressure and that the downtrend may continue. Investors should pay attention to such high-volume movements and adjust their positions accordingly.
Low-volume price movements, on the other hand, should be evaluated more cautiously. For instance, if the price of an asset approaches a key level with low volume, this may signal that the price movement is not sustainable and could be a false signal.
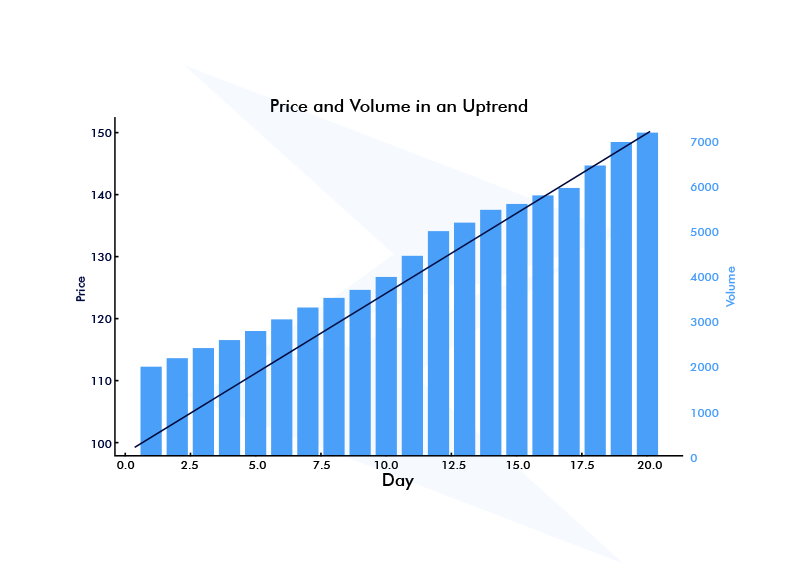
In the graph above, we see the price movements (blue line) and trading volume (red bars) during an asset's bullish trend. Let's analyze this graph together:
Price movements reflect the balance of supply and demand for an asset, while volume indicates the strength behind those movements. Price movements supported by high volume are generally considered reliable and strong, whereas low-volume price movements are often seen as weak or temporary.
Now, to better understand the relationship between price and trading volume, let's review the table below:
|
Volume |
Price Movement |
What It Indicates |
|---|---|---|
| High | Rising | Strong bullish momentum, trend likely to continue |
| High | Falling | Strong bearish momentum, trend likely to continue |
| Low | Rising | Weak upward movement, possible reversal or correction |
| Low | Falling | Weak downward movement, potential trend reversal |
| Increasing | Breaking resistance | Confirmation of a breakout, further upward movement expected |
| Decreasing | Rising | Lack of conviction, potential for a pullback or correction |
Does trading volume affect stock price?
Trading volume does not directly affect the stock price, but changes in volume can influence price movements. High trading volume may indicate strong buying or selling pressure, which can cause price shifts.
What does a high trading volume indicate?
High trading volume suggests strong market interest, with many investors actively buying and selling. This often indicates increased confidence in an asset or the impact of important news or events.
What does low trading volume indicate?
Low trading volume indicates a decrease in market interest and fewer active investors. This can weaken the reliability of price movements and raise doubts about the sustainability of the current trend.
How is trading volume used in technical analysis?
Trading volume is used to measure the strength and validity of price movements. High-volume price movements are generally considered strong and reliable, while low-volume movements may be seen as weak or temporary. Additionally, volume increases during a breakout of support or resistance levels can confirm the validity of the breakout.
What are RSI signals in rising volume?
During rising trading volume, RSI can signal overbought or oversold conditions. If RSI rises above 70 with increasing volume, it can be interpreted as an overbought signal, suggesting a potential price pullback. Similarly, if RSI drops below 30 with rising volume, it may signal oversold conditions.
How is momentum measured with trading volume?
Rising volume can be a sign of increasing momentum, indicating a strong movement in the market. Conversely, falling volume may signal weakening momentum, suggesting a possible trend reversal.
How do I detect reversals with volume analysis?
Volume analysis can be effective in detecting reversals. If volume decreases near the end of a trend, it may indicate that the trend is weakening and a reversal is more likely. Additionally, if the volume is low during a break of key support or resistance levels, this may indicate a false breakout and signal a potential reversal.
Sign up in seconds for free, access your platform, and start trading with ease.
 $200 Oil Scenario: The Chain Reaction Across Markets
What happens if oil hits $200? See the impact on global markets, sectors, inflation, and which industries could win or lose.
Detail Biggest Manipulations in Financial Market History
Financial markets have seen their share of manipulation over the years. Here are seven of the biggest cases in modern history.
Detail Petrodollar System: Why It Still Matters
Energy markets depend on supply routes, currency systems, and trade infrastructure determine prices, inflation, and financial stability across the global economy.
DetailThen Join Our Telegram Channel and Subscribe Our Trading Signals Newsletter for Free!
Join Us On Telegram!


