


For forex and stock market traders, understanding the direction and strength of a trend is a key component in building a successful strategy. This is where one of the technical analysis tools, the ADX (Average Directional Index), comes into play.
The ADX stands out from other indicators because it specifically measures the strength of a trend. Knowing whether a trend is strong or weak helps investors make more confident decisions and identify the right entry and exit points in the market.
The ADX indicator not only identifies whether there is a trend but also helps determine if the market is moving sideways or in a directional trend. Opening positions in a strong trend is generally more advantageous, while trading during weak trends tends to be riskier.
The Average Directional Index (ADX) is a technical analysis indicator used to measure the strength of a trend. It does not indicate whether an asset is in an uptrend or downtrend but shows how strong the current trend is. The ADX was developed by J. Welles Wilder in 1978. Since then, it has become particularly popular among trend-following traders.
ADX is usually used in combination with the +DI (Positive Directional Indicator) and -DI (Negative Directional Indicator). While these two additional indicators help determine the direction of the trend, the ADX measures the strength of the trend. This way, traders can understand both the direction in which the market is moving and how strong that movement is.
The calculation of the ADX requires considering the price changes between the high and low levels of a financial instrument. The core components of this process are +DI (Positive Directional Indicator), -DI (Negative Directional Indicator), and True Range (TR).
Let's start by calculating the True Range (TR). TR is determined by selecting the largest value among the following three calculations:
The formula for TR is as follows:
TR = max( H – L, |H – Cprev|, |L-Cprev|)
After calculating the TR, the +DM (Positive Directional Movement) and -DM (Negative Directional Movement) values must be calculated. These values measure how much the prices have moved up or down compared to the previous days:
The formulas are as follows:
+DM = Htoday – Hprev
-DM = Lprev – Ltoday
Next, the directional movement indicators +DI and -DI are calculated. These values express the directional price movements as percentages. They are calculated by dividing the positive and negative directional movements by the True Range (TR) and then multiplying by 100 to express them as percentages.
The formulas are as follows:
+DI = (+DM/TR) x 100
-DI = (-DM/TR) x 100
After this, the Directional Index (DX) is calculated. The DX value is obtained by dividing the difference between +DI and -DI by their sum and then multiplying by 100.
The formula is as follows:
DX = (|+DI – –DI| +DI + –DI) x 100
Finally, the ADX value can be calculated. The ADX value is derived by taking the exponential moving average (EMA) of the DX values over a specific period, typically 14 days.
The ADX formula is: ADX = EMA(DX, 14)
The Average Directional Index (ADX) is an essential technical analysis indicator used to measure the strength of a trend in the market. However, ADX does not indicate the direction of the trend but rather shows how strong or weak the existing trend is. It is highly useful in trend-following strategies and helps traders determine whether the market is trending or moving sideways.
| ADX Value | Interpretation | Trading Strategy Suggestion |
| 0-20 | Weak or no trend | Avoid trend-following strategies; focus on range trading. |
| 20-25 | Beginning of a potential trend | Watch for breakouts or potential trend formation. |
| 25-50 | Strong trend | Suitable for trend-following strategies. |
| 50-75 | Very strong trend | High confidence in trend continuation; manage risk carefully. |
| 75-100 | Extremely strong trend | Be cautious of overbought/oversold conditions; consider taking profits. |
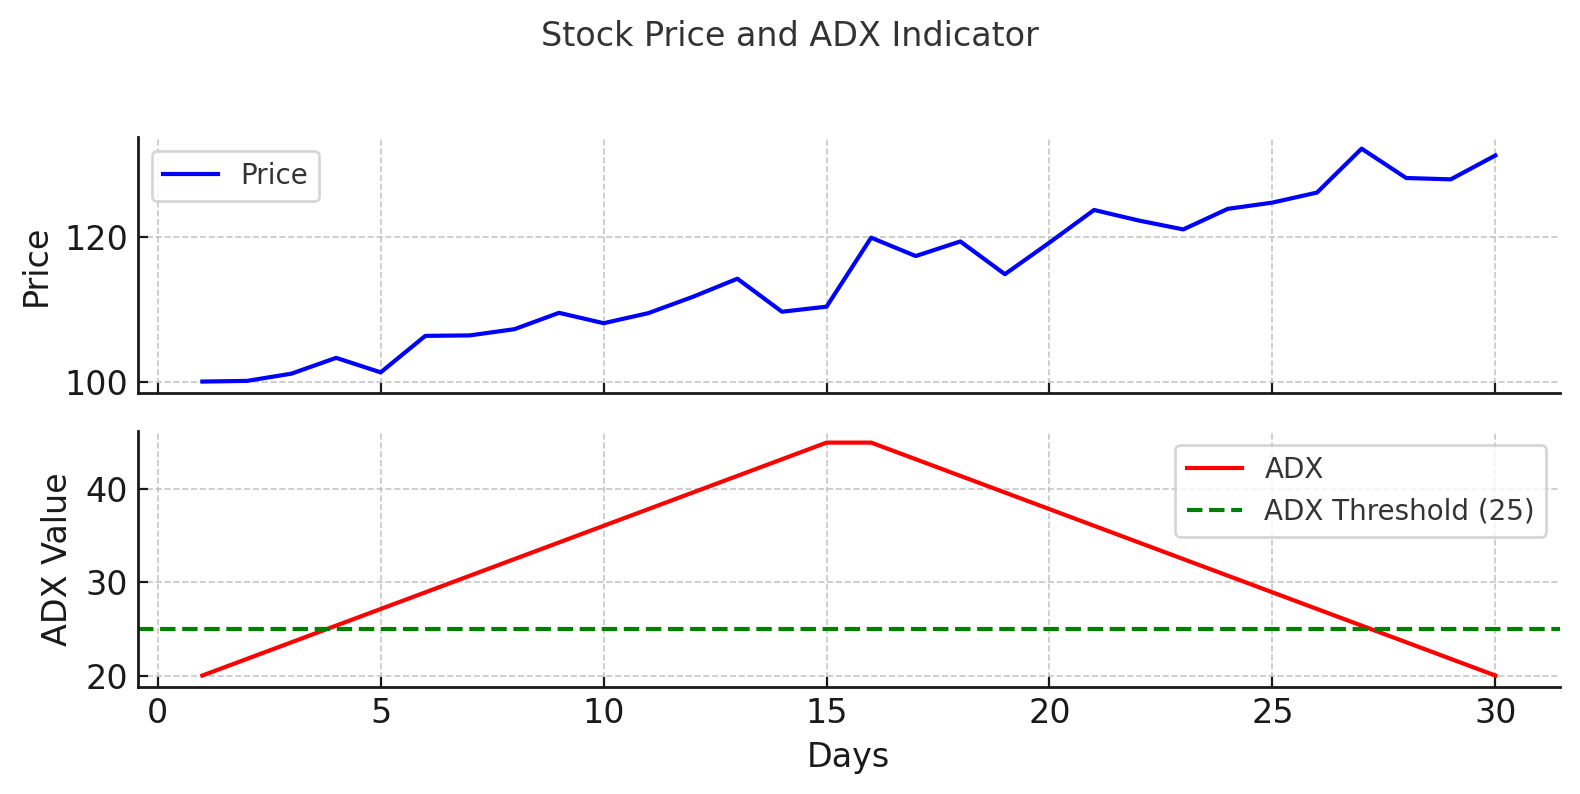
In the above chart, we can see the 30-day price movements of a stock and the corresponding ADX values during this period. The upper part of the chart shows price movements with a blue line, while the lower part displays ADX values with a red line. The green dashed line marks the 25 level of the ADX indicator.
Now, let's start interpreting the chart:
While ADX (Average Directional Index) measures the strength of a trend, DMI (Directional Movement Index) identifies the direction of the trend. This combination is particularly effective in trend-following strategies. It helps to filter out false signals and build a more reliable trading plan.
The DMI indicator consists of two lines: +DI (Positive Directional Indicator) and -DI (Negative Directional Indicator). The +DI line indicates an upward trend in the market, while the -DI line signals a downward trend. ADX, on the other hand, measures the strength of the identified trend. By analyzing the intersections of the +DI and -DI lines and the ADX value, traders can gather important insights about the market trend.
Here’s how to interpret the ADX and DMI indicators together:
The Aroon indicator measures whether an asset is entering an upward or downward trend and the strength of that trend. It consists of two lines: Aroon Up and Aroon Down.
The Aroon indicator is more suitable for early trend detection and can identify trend reversal points more quickly. On the other hand, the ADX is more effective in understanding the strength of an existing trend and provides more reliable results in long-term analysis.
Below is a table comparing the Aroon and ADX indicators based on different features:
| Aroon Indicator | ADX Indicator |
| Measures trend direction and strength | Measures only trend strength |
| Consists of Aroon Up and Aroon Down lines | Consists of ADX, +DI, and -DI lines |
| Helps identify trend reversal points | Helps determine the strength of an ongoing trend |
| More suitable for early trend detection | More suitable for confirming established trends |
| Can produce faster signals in trending markets | Provides more reliable signals in long-term analysis |
| Suitable for short-term and swing trading | Suitable for long-term trend-following strategies |
| May produce false signals in sideways markets | Filters out weak trends and consolidations |
| Easier to interpret for beginners | Requires additional indicators to confirm signals |
| Helps identify the start of new trends | Helps avoid trading in weak or non-trending markets |
| Provides signals based on time-based price highs and lows | Provides signals based on price movement volatility |
What Is a Good Average Directional Index?
An ADX value of 25+ signals a strong trend, while below 20 indicates a weak or directionless market. Values between 20-40 show a forming trend, and above 40 reflect a strengthening trend with trading opportunities. Traders view ADX above 25 as a reliable indicator of a solid trend.
What Is the Best Indicator to Use With ADX?
Although the ADX indicator measures the strength of a trend, it does not indicate the direction of the trend. Therefore, it is more effective when used alongside other indicators. For example, the RSI indicator can be used with ADX to identify whether the market is in overbought or oversold conditions. The MACD indicator helps analyze both the direction and momentum of a trend, providing stronger signals when combined with ADX. Additionally, Bollinger Bands and the Parabolic SAR can be used with ADX to offer more accurate market analysis.
How do you set up the ADX indicator?
To set up the ADX indicator, open your trading platform, such as MetaTrader, where ADX is built-in. Select the ADX from the technical indicators section, typically set to a 14-period calculation, but adjustable if needed. Ensure the +DI and -DI lines are displayed, and customize their colors for clarity. Once added, analyze the trend's strength and direction.
Sign up in seconds for free, access your platform, and start trading with ease.
 U.S. Home Prices: How Traders Read the Data
Learn how to read U.S. home price data, compare key reports, and understand what strong or weak results may mean for markets.
Detail Dow Jones Industrial Average: All You Need to Know
Learn what the Dow Jones Index is, how the DJIA is calculated, what moves it, and how traders can use it in market analysis.
Detail Futures Explained: How Futures Trading Works
Learn what futures are, how futures trading works, and how to read contracts, margin, expiry, and risk before you trade.
DetailThen Join Our Telegram Channel and Subscribe Our Trading Signals Newsletter for Free!
Join Us On Telegram!


