



Markets do not always move in a clear trend. On certain occasions, the price can slow down and move sideways, and it gets stuck between two price areas. This situation is called a consolidation phase.
For beginners, this can feel confusing because the chart still moves, but there is no clear direction. To make things clear, it is important to understand where price is trapped, then look at what happened before the range and what could happen after it breaks.
Consolidation means the price is moving sideways instead of trending up or down. It usually happens when the market takes a breather after a big, powerful move. Both buyers and sellers are active, but neither side has enough muscle to take full control.
On the chart, you will see the price bouncing back and forth between a clear support floor and a resistance ceiling. Buyers step in near the lower side of the range. Sellers appear near the upper side. This creates a trapped price zone.
Consolidation is also called a sideways market, a range-bound market, or simply a price range. It doesn't guarantee that the market will eventually explode higher or crash lower. Instead, it just shows that the price is catching its breath and waiting for its next clear direction.
Consolidation happens after a strong price move. Traders may start taking profit. New buyers may wait for a better entry. New sellers may also enter the market. This creates a balance between both sides.
It can also happen before major news or data. Traders may wait for CPI, NFP, central bank decisions, or earnings reports. During this time, price may stay inside a range until the market gets a new reason to move.
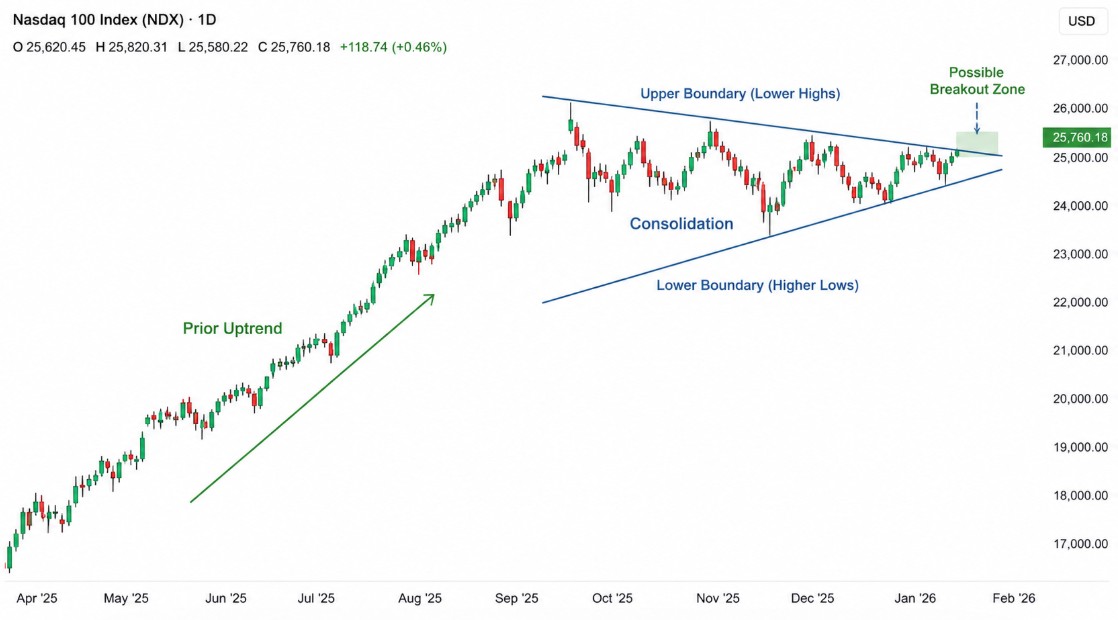
The first sign of consolidation is a loss of clear direction. Price stops making clean higher highs or lower lows. Instead, it starts moving sideways. Candles overlap each other. The market looks active, but it does not move far.
A simple way to spot it is to mark the upper and lower areas of the range. The upper area acts as resistance. The lower area acts as support. If price keeps reacting from both sides, the market may be consolidating.
In the Nasdaq 100 example above, the market first had a strong uptrend. Then price started to slow down. It made lower highs near the upper boundary and higher lows near the lower boundary. This created a triangle-shaped consolidation.
You can also watch the size of the candles. During consolidation, candles become smaller. Volatility may fall as well. This shows that the market is waiting. A stronger move comes later, after price breaks out of the range.
Consolidation comes after a strong price move. The market may rise fast or fall fast first. Then price starts to slow down. This shows that the previous move is losing momentum.
After an uptrend, buyers may begin taking profit. New buyers may also wait for a pullback. This can cause price to move sideways instead of continuing higher.
After a downtrend, sellers may begin closing their trades. New sellers may wait for a better entry. This can also create a sideways range.
Sideways price action can also appear before important news. Traders may wait for inflation data, jobs numbers, earnings, or a central bank decision. During this waiting period, price may stay trapped until the next strong catalyst arrives
During consolidation, traders should slow down. The market has no clear direction yet. This is not the best time to chase every small move.
A beginner has three main choices. The first choice is to wait. This is the safest option. Let price show a clear breakout or breakdown first.
The second choice is to trade the range. This means looking for buy setups near support and sell setups near resistance. The middle of the range is not a good place to enter most of the time.
The third choice is to prepare for the next move. Mark the range. Watch the upper and lower boundaries. Then wait for price to close outside the range. A confirmed break is better than guessing early.
The main rule is simple. Do not force trend trades inside a sideways market.
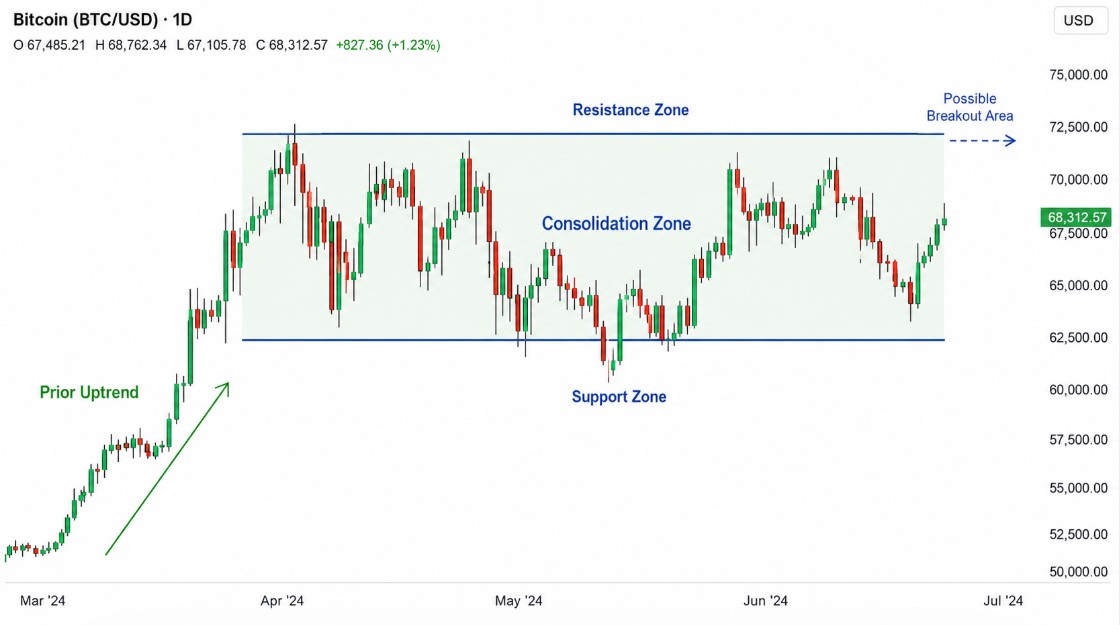
Start by finding the latest area where price stopped trending. Look for a repeated high and a repeated low. The high area becomes resistance. The low area becomes support.
Do not draw the zone from one candle only. Wait for price to react from the same area more than once. This gives the zone more meaning. Do not draw the zone from one candle only. Wait for price to react from the same area more than once. This gives the zone more meaning. A clear range usually has several touches on both sides.
In the Bitcoin chart above, price first moved higher. Then it started moving sideways between the support and resistance areas. The shaded box shows the consolidation zone. Price stayed inside that box for weeks.
You should draw zones, not thin lines. Price will not always react from the exact same number. Wicks may move slightly above or below the range. What matters is where price keeps rejecting and returning inside the zone.
A simple process can look like this:
The goal is to understand where price is trapped. Once you see that area clearly, it becomes easier to wait, trade the edges, or prepare for a breakout.
Trading inside a consolidation range means trading between support and resistance. The idea is simple. Traders look for buy setups near support and sell setups near resistance.
A buy setup may appear when price reaches the lower side of the range. This is where buyers stepped in before. A trader may wait for a rejection candle, a small bounce, or weaker selling pressure. The stop-loss is placed below the support zone.
A sell setup may appear when price reaches the upper side of the range. This is where sellers appeared before. A trader may wait for rejection from resistance. The stop-loss is placed above the resistance zone.
The middle of the range is the weakest area to trade. Price can move up or down from there. It also gives poor risk-reward. Beginners should avoid entering in the middle.
A simple range plan can look like this:
Range trading works best when the zone is clear. It also needs enough space between support and resistance. If the range is too tight, spreads and sudden moves can make the setup less useful.
After consolidation, price breaks out of the range. This can happen to the upside or downside. The direction depends on which side takes control.
A breakout does not mean price only touches the range boundary. A better signal comes when price closes outside the zone. Traders may also wait for a retest. This helps reduce the risk of a false breakout.
A bullish breakout happens when price closes above the resistance zone. This shows that buyers are strong enough to push price out of the range.
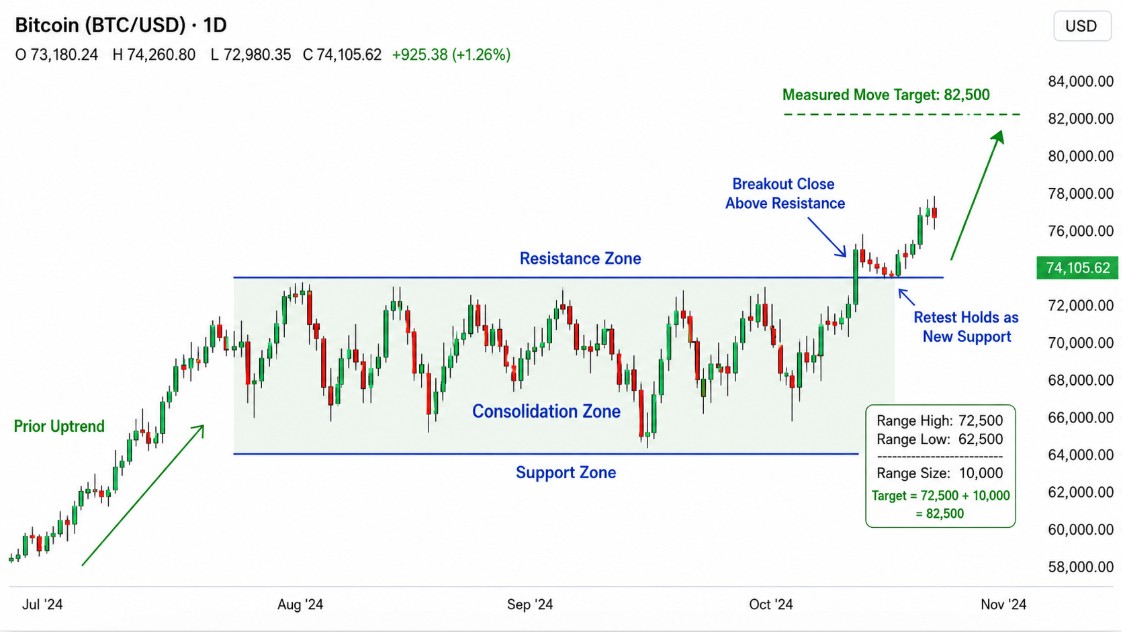
For example, Bitcoin may consolidate between 62,500 and 72,500. The upper side of the range is resistance. If price closes above 72,500 with strong momentum, the range may be breaking to the upside.
A trader does not need to buy the first touch above resistance. A safer plan is to wait for confirmation. Price may break above 72,500, then pull back to test the same area again. If it holds as support, buyers may enter again.
The range height can also help with a basic target.
This does not mean price must reach 82,500. It is only a simple projection. Traders should still watch momentum, volume, and market news.
A bearish breakdown happens when price closes below the support zone. This shows that sellers are taking control.
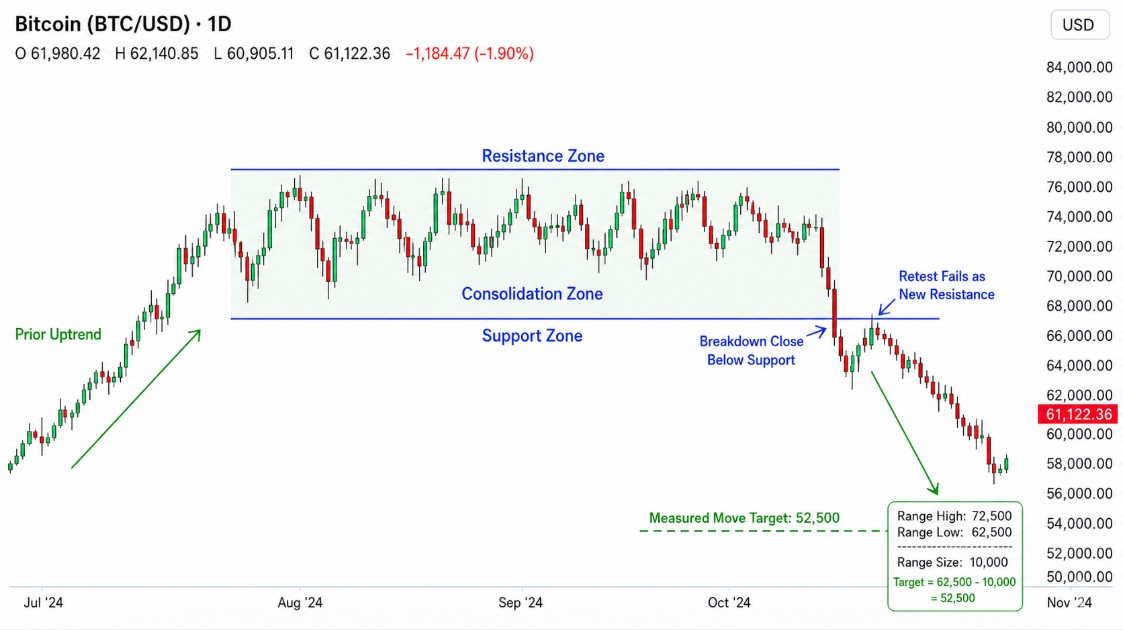
Using the same Bitcoin example, support is near 62,500. If price closes below 62,500 with a strong candle, the range may be breaking to the downside.
Again, confirmation matters. Price may break below support, then return to test 62,500 from below. If that area now acts as resistance, sellers may stay in control.
The range height can also be used for a basic downside target.
A breakdown can move fast, especially after price spends a long time inside a range. Beginners should avoid chasing the move too late. The best trade is planned before the break happens.
Indicators can help when price is moving sideways, but they should not replace price action. Use them to confirm what you already see on the chart.
The best approach is simple. First mark support and resistance. Then use indicators only as extra confirmation.
Consolidation is a normal part of market movement. Price cannot trend forever. Sometimes it needs time to pause, build pressure, and choose the next direction. For traders, the goal is not to guess the break early. The goal is to mark the range, wait for clean levels, and act only when the setup makes sense.
Try not to trade in the middle of the range. Do not enter before confirmation, and do not assume every breakout is real.
Sign up in seconds for free, access your platform, and start trading with ease.

 How Index Futures Influence the Stock Market Open
How do index futures influence the stock market open? Learn what pre-market moves reveal about opening prices, market sentiment, and trader psychology.
Detail What Is the Nasdaq?
What is the Nasdaq? Learn how the Nasdaq Composite Index works, which stocks it includes, and what influences its performance.
Detail What Is the FTSE 100?
The FTSE 100 tracks the largest companies listed on the London Stock Exchange. Explore how it is calculated and what influences its performance.
DetailThen Join Our Telegram Channel and Subscribe Our Trading Signals Newsletter for Free!
Join Us On Telegram!


