


There are many formations used in technical analysis to interpret price movements and trends. These formations reflect the perceptions and behaviors of market participants regarding a particular asset, providing clues about future price movements. Rectangle patterns are one of these tools.
Rectangle chart patterns emerge during periods when prices fluctuate within a horizontal range over a certain period. They indicate a state of equilibrium and indecision in the market.
By examining our article, you can learn more about rectangle formations.
A rectangle chart pattern is a technical analysis formation where prices fluctuate within a horizontal band for a certain period. It indicates that prices are confined between support and resistance levels for a specific duration.
The pattern typically emerges during sideways trends or consolidation periods. During these times, there is a balance between buyers and sellers, and the market remains undecided before making a strong move in a particular direction.
In a rectangle chart pattern, prices fluctuate between support and resistance levels for a certain period of time. When prices approach the upper resistance, selling pressure increases, causing prices to fall. Conversely, when prices approach the lower support, buying pressure increases, causing prices to rise again. This cycle results in prices moving within a horizontal channel.
The formation can provide important signals about whether the trend will continue or reverse. When prices break through either the support or resistance, a strong price movement is usually expected. Traders should pay particular attention to these breakouts for buying and selling opportunities.
Rectangle formations can be divided into two; bullish and bearish:
The bullish rectangle pattern emerges during an uptrend. It is considered a signal that the uptrend will continue.
The pattern forms as prices oscillate between support and resistance for a certain period. When prices approach the upper resistance level, they encounter selling pressure and begin to decline.
Conversely, when prices approach the lower support level, they encounter buying pressure and rise again. These movements cause prices to fluctuate within a horizontal channel.
The pattern completes when prices break above the resistance level, initiating an upward movement. This breakout indicates the continuation of the uptrend.
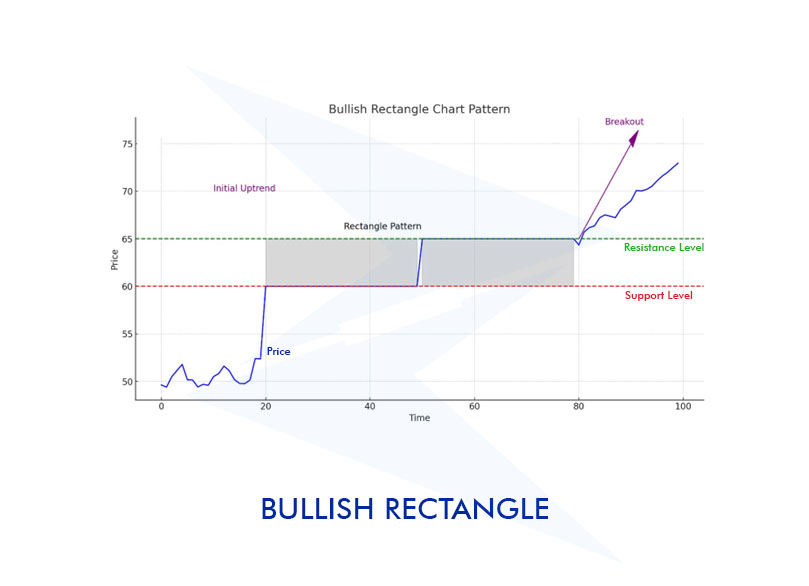
In the example chart above, we observe the following:
A bearish rectangle pattern occurs during a downtrend. This pattern is considered a signal that the downtrend will continue.
The pattern forms when prices move horizontally between support and resistance levels for a certain period. When prices approach the lower support, they encounter buying pressure and start to rise. Conversely, when they approach the upper resistance, they face selling pressure.
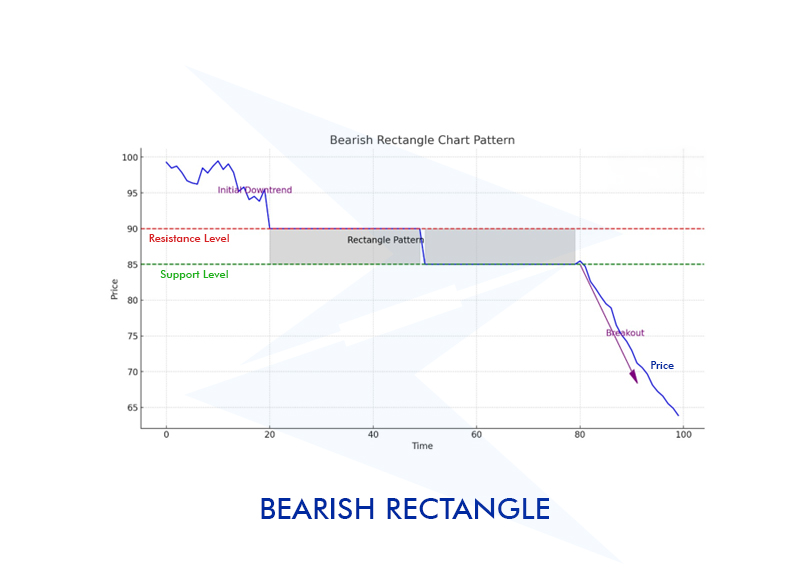
In the above chart, we generally observe the following:
The rectangle chart pattern indicates that prices are moving within a horizontal range for a certain period. This suggests a balance between buyers and sellers, with no clear trend emerging.
The pattern can provide clues about whether the current trend will continue or reverse. Traders need to watch for a breakout above the resistance level or below the support level. The direction of the breakout gives investors a clue as to whether they should take a buying or selling position.
Under which market conditions does the rectangle chart pattern occur?
The rectangle chart pattern typically occurs during periods of consolidation when the market is moving sideways, meaning there is no clear trend.
In which timeframes is the rectangle chart pattern most effective?
The rectangle chart pattern can be effective in both short-term and long-term timeframes. However, patterns formed over longer timeframes (daily or weekly charts) are generally more reliable than those formed over shorter timeframes (hourly or minute charts).
How are breakouts identified in the rectangle chart pattern?
Breakouts in the rectangle chart pattern are identified when prices move significantly outside of the support or resistance levels. These breakouts are usually supported by high volume and are considered buy or sell signals for traders.
How is volume interpreted in the rectangle chart pattern?
Volume is an important indicator for confirming the reliability of breakouts. Increasing volume indicates a strong breakout, suggesting that prices will continue in the breakout direction. Conversely, breakouts on low volume are generally less reliable.
In which situations does the rectangle chart pattern fail?
The pattern can fail in situations where unexpected news or events cause sudden market movements. Additionally, breakouts occurring with low volume and prolonged formation periods can lead to the pattern failing.
Does the rectangle chart pattern indicate trend reversal or trend continuation?
The pattern can indicate both trend reversal and trend continuation, depending on the direction of the breakout. A breakout above the resistance level suggests the continuation of an uptrend, while a breakout below the support level indicates the continuation of a downtrend.
How do you perform backtesting using the rectangle chart pattern?
To backtest the rectangle chart pattern, analyze historical price data to identify points where the pattern formed and broke out. This data can then be used to evaluate the effectiveness of a particular trading strategy.
Can scalping be done using the rectangle chart pattern?
Yes, scalping can be done using the rectangle chart pattern. Scalping aims to profit from short-term price movements, and the horizontal movements within the rectangle pattern provide buy and sell opportunities for scalpers.
Can the rectangle chart pattern be used in automated trading systems?
Yes, the rectangle chart pattern can be used in automated or algorithmic trading. Algorithms can be designed to identify specific support and resistance levels and monitor breakouts to execute buy or sell trades automatically.
Sign up in seconds for free, access your platform, and start trading with ease.
 $200 Oil Scenario: The Chain Reaction Across Markets
What happens if oil hits $200? See the impact on global markets, sectors, inflation, and which industries could win or lose.
Detail Biggest Manipulations in Financial Market History
Financial markets have seen their share of manipulation over the years. Here are seven of the biggest cases in modern history.
Detail Petrodollar System: Why It Still Matters
Energy markets depend on supply routes, currency systems, and trade infrastructure determine prices, inflation, and financial stability across the global economy.
DetailThen Join Our Telegram Channel and Subscribe Our Trading Signals Newsletter for Free!
Join Us On Telegram!


