


Support and resistance levels are two key indicators in financial markets. Accurate analysis of these levels helps investors take correct positions. Investors across various markets, particularly in stock markets, monitor support and resistance levels closely.
Support and resistance levels represent the points at which price movements are likely to pause or reverse. While these levels provide insights for any asset traded in the markets, they should not be used alone as sole tools.
A support level indicates a price point where a downward trend is expected to halt. Conversely, a resistance level signifies a price point where an upward trend may pause.
A support level refers to a price point at which a falling asset's price tends to halt and possibly reverse direction. This is typically due to an increased concentration of buying interest at that level.
When the price of an asset reaches its support level, buyers are inclined to purchase at these lower prices, creating a potential for the price to rise again. Therefore, an asset reaching a support level can present a buying opportunity.
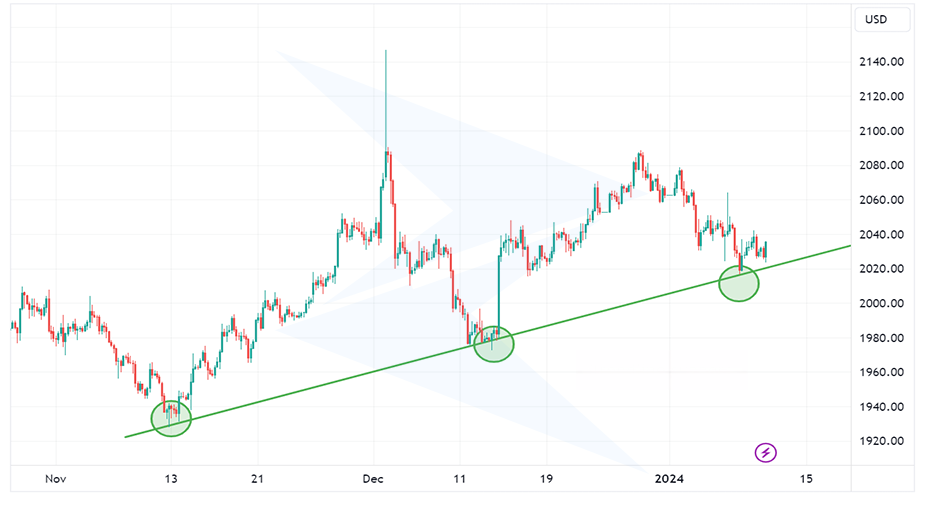
However, it's important to note that a support level on its own does not guarantee a reversal. If the price falls below this level, it can lead to a sharp downward trend.
Resistance levels are one of the main indicators that provide investors with insights into the potential future price movements of traded assets.
A resistance level represents a price point where an asset's upward movement tends to pause and possibly reverse. This level is often regarded as the highest point an asset is likely to reach before sellers start to dominate the market.
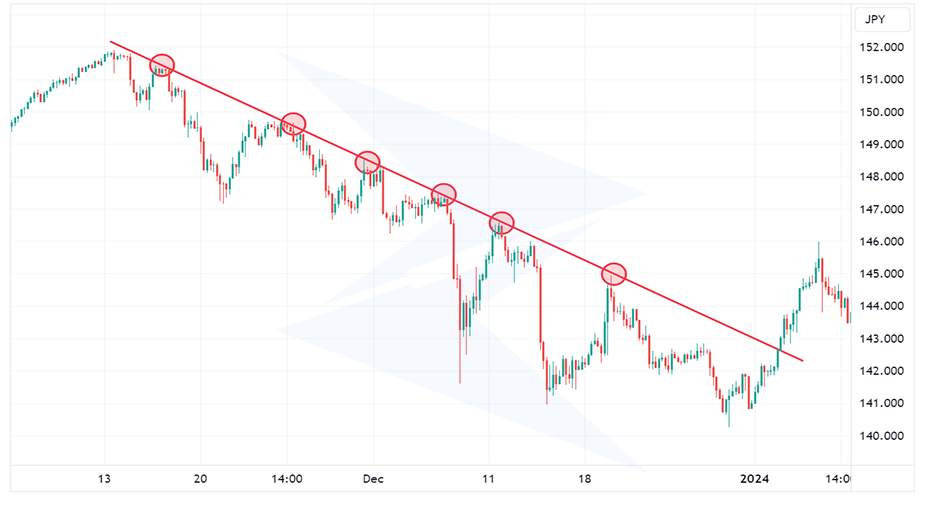
Historically, resistance levels are identified at price points where the asset previously halted its upward movement and where there was a selling interest. When the price reaches a resistance level, sellers are likely to take profits. This increases the selling pressure and potentially causes the price to fall again.
Here are the key factors in determining and calculating:
We will explain each factor in the next chapter of the article. But for now, let’s focus on the logic behind the calculations.
Today, many markets offer automated tools for calculating support and resistance levels, making it easier for investors to identify these key price points. However, these tools alone are not sufficient. To accurately determine support levels, technical analysis is required.
These levels usually appear as horizontal lines on price charts, indicating the price range within which the support level is evident.
Calculating resistance levels involves identifying the points at which an asset's price has previously halted its upward movement. These levels provide traders with insights into potential price reversals or pauses in upward trends.
When calculating resistance, there will likely be points where the price has been tested multiple times but has not been able to break through. This indicates strong selling pressure at those levels.
Support and resistance levels play a key role for traders, but they don't guarantee certainty. Occasionally, these levels can be broken, resulting in notable outcomes for traders.
When a support level is broken, it means the asset’s price has fallen below a previously established support point, which means that the downward trend continues. In such cases, the former support level often becomes a new resistance level.
Conversely, when a resistance level is broken, it indicates that the asset’s price has surpassed a previously established resistance point. This breakout suggests that the upward trend is continuing.
When the price breaks through the resistance level, this former resistance becomes a new support level.
For instance, if a stock with a support level at $50 falls below this price, it might continue to drop to $45 or lower. On the other hand, if the same stock breaks through a resistance level at $100, it might rise to $110 or higher.
There are two main factors that influence breakouts:
Identifying support and resistance levels involves using various tools and indicators that provide significant insights into where investors might consider buying or selling assets. These levels are essential for making informed trading decisions and developing effective strategies.
Here are some common methods for determining support and resistance levels;
Observing past price actions, such as previous highs, lows, and closing prices, can help traders identify key levels of support and resistance. These historical levels can indicate where the price might struggle to move past, based on past trading activity.
For example, if a stock has historically struggled to rise above $75 and has consistently found support at $50, these levels can be marked as resistance and support, respectively.
Using Fibonacci ratios (such as 38.2%, 50%, and 61.8%), traders can identify potential reversal levels where the price might find support or resistance after a significant move.
Suppose a stock moves from $50 to $100. Applying Fibonacci retracement levels, you might find support at $76.4 (61.8% retracement) and resistance at $61.8 (38.2% retracement).
Trend lines are calculated using the previous day's high, low, and close prices, pivot points and their associated support and resistance levels provide a framework for understanding potential price movements.
If a stock repeatedly rises to $60 and falls to $40, drawing horizontal lines at these levels can help identify resistance and support.
Understanding the psychology behind support and resistance levels can provide deeper insights into market behavior and help traders predict price movements more effectively.
Consider a group of buyers who have been purchasing a stock near a support level of $50. They are pleased with their decision as the stock price rises to $55. These buyers are likely to place additional buy orders at $50, creating a demand zone at this level. Their willingness to buy more at the support level reinforces it, as they perceive $50 as a bargain price.
Another group of investors might have considered buying the stock at $50 but hesitated and missed the opportunity as the price increased to $55. Experiencing regret, these investors resolve to buy the stock if it drops back to $50, thereby increasing the potential demand at this level. Their anticipation of a second chance at $50 strengthens the support.
A third group consists of investors who bought the stock at $40 and sold it at $50, only to watch it climb to $55. Regretting their early sale, they plan to buy back the stock at $50 if the price falls to that level again. This shift in sentiment from selling to buying contributes to the demand at the support level, reinforcing it further.
Now, let's consider resistance levels. Suppose the stock rises to $55 and then falls back to $50, where it was initially purchased by various investors. Those who didn’t sell at $55 might feel regretful and resolve to sell if the price reaches $55 again. When the stock price approaches $55 once more, these investors, along with others, sell their shares, creating selling pressure and forming a resistance level at $55.
Investors who bought the stock at lower prices might also see $55 as an optimal point to take profits. As the price reaches $55, they sell, adding to the supply and reinforcing the resistance level. This collective action of selling at a perceived peak creates a barrier that the price struggles to overcome.
A fundamental concept in technical analysis is the role reversal of support and resistance levels. When a resistance level is broken, it often becomes a support level, and vice versa.
This phenomenon occurs because the dynamics of supply and demand have shifted. For example, if the price falls below a support level, that level now becomes a resistance point as traders who bought at the support level might sell to break even or minimize losses.
Conversely, when the price breaks above a resistance level, it becomes a new support level as traders who missed the initial buying opportunity are now willing to buy at the resistance level, expecting the price to continue rising.
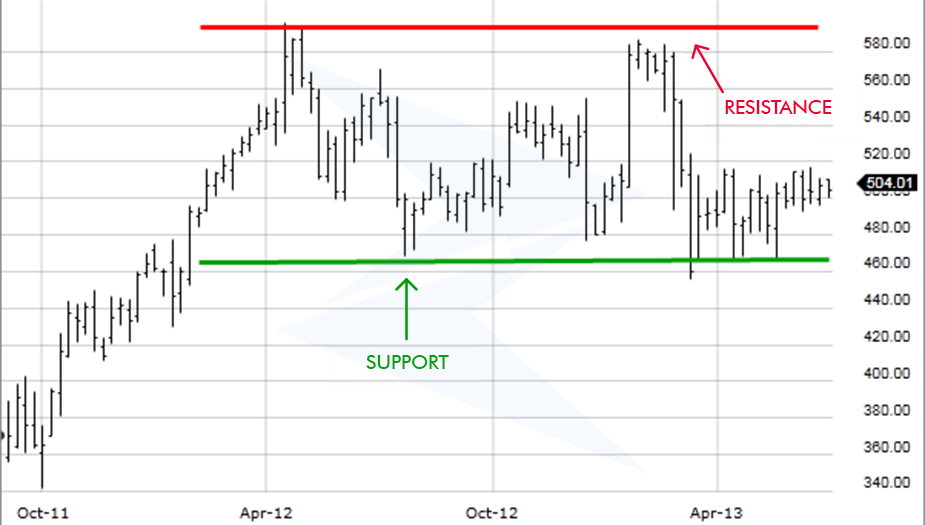
The chart demonstrates a classic example of resistance turning into support. Initially, the price struggled to break through the resistance level marked in red. After several attempts, the price finally broke through this resistance level and continued to rise. Once it retraced, the previously established resistance level acted as a new support level, indicated by the green line.
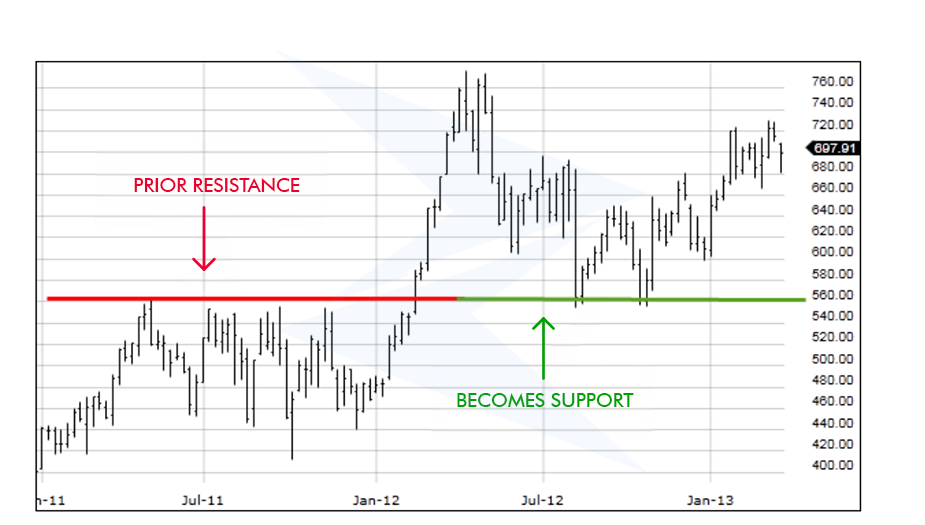
In the chart, the price repeatedly fails to move above this level, indicating strong selling pressure.
After breaking above the resistance, the price retraces and finds support at the previous resistance level. This is quite important for traders to recognize as it can provide new entry points.
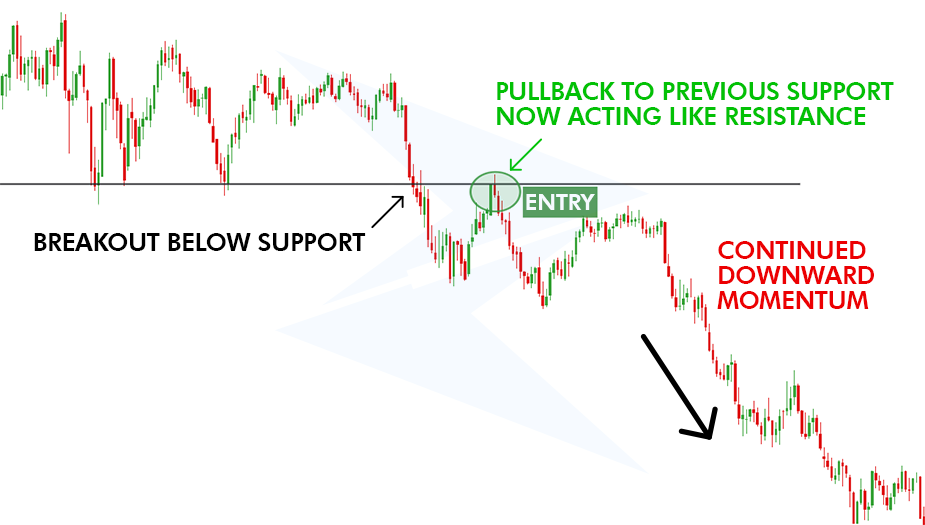
The concept of support turning into resistance is an important aspect of technical analysis. This occurs when the price of an asset falls below a support level and then returns to test that same level, which now acts as resistance.
This change reflects a shift in market sentiment, where buyers who previously saw the level as a bargain now see it as a threshold to sell.
In the chart provided, we can observe the transition of a support level into resistance.
Initially, the price found support around the $34 level, as indicated by the green line. This level held as buyers stepped in to prevent the price from falling further.
After the price eventually broke below the $34 support level, it fell significantly. When the price later attempted to rise, it struggled to move past the $34 level, which had now turned into a resistance point, marked by the red line. Sellers emerged at this level, reinforcing it as a new barrier that the price had difficulty overcoming.
Sign up in seconds for free, access your platform, and start trading with ease.
 $200 Oil Scenario: The Chain Reaction Across Markets
What happens if oil hits $200? See the impact on global markets, sectors, inflation, and which industries could win or lose.
Detail Biggest Manipulations in Financial Market History
Financial markets have seen their share of manipulation over the years. Here are seven of the biggest cases in modern history.
Detail Petrodollar System: Why It Still Matters
Energy markets depend on supply routes, currency systems, and trade infrastructure determine prices, inflation, and financial stability across the global economy.
DetailThen Join Our Telegram Channel and Subscribe Our Trading Signals Newsletter for Free!
Join Us On Telegram!


