


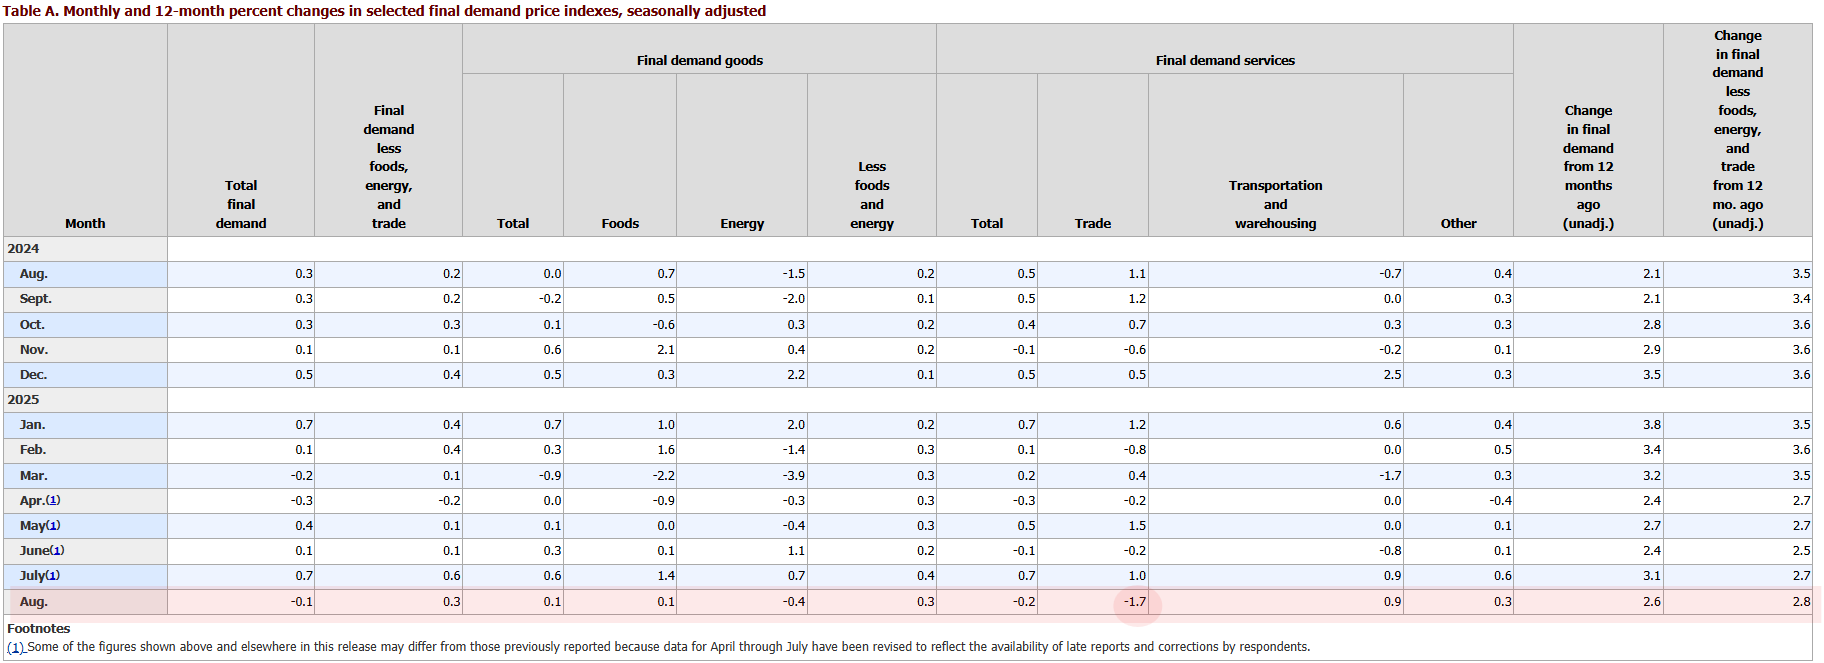
The Producer Price Index (PPI) for final demand declined by 0.1% in August, according to data from the Bureau of Labor Statistics.
The Producer Price Index (PPI) for final demand declined by 0.1% in August, according to data from the Bureau of Labor Statistics. The dip follows increases of 0.7% in July and 0.1% in June, underlining a turbulent summer for producer-level inflation. On an annual basis, the index rose 2.6%.
The overall fall was driven largely by weaker service prices. Trade service margins dropped by 1.7%, dragging the index lower despite strength in other categories. Transportation and warehousing costs climbed, while portfolio management posted a notable 2.0% increase.
Key drivers in services:
Goods prices rose 0.1% in August, with mixed trends across categories. When excluding food and energy, goods prices advanced 0.3%. Energy costs fell 0.4%, while tobacco products surged 2.3%, providing the largest upward push. Natural gas, vegetables, and copper scrap all registered declines.
Core PPI, which strips out food, energy, and trade services, climbed 0.3% in August and 2.8% over the past year. This marks the strongest annual gain since March 2025, reinforcing that inflationary pressures at the producer level remain resilient despite headline volatility.
Markets on Thursday leaned toward a dovish global outlook, lifting precious metals and reshaping major currency moves.
Detail Gold Climbs, Yen Recovers on Soft US Signals (12.03.2025)Rate-cut expectations overtook Wednesday trading.
Detail Traders Trim Risk, Rate Bets Drive the Tone (12.02.2025)Markets traded cautiously on Tuesday as shifting rate expectations and profit-taking shaped moves across assets.
DetailThen Join Our Telegram Channel and Subscribe Our Trading Signals Newsletter for Free!
Join Us On Telegram!


