


Relative Strength Index (RSI) is a technical analysis indicator that compares the closing prices of a stock or financial instrument over a given period with the previous closing prices of the base period. RSI values are displayed as an oscillator represented by a line chart that moves between two extremes.
The RSI indicator was first introduced by J. Welles Wilder Jr. in his book New Concepts in Technical Trading Systems, written in 1978.
The importance of the RSI value for investors comes from the compatibility between the trend line of the RSI chart and the trend line of the short and medium-term price of the financial instrument. For this reason, it is a popular indicator among investors.
The RSI indicator is particularly valuable for short-term market analysis as it often moves up or down before the instrument price changes, allowing traders to predict market direction. This quality is one of the key reasons the RSI indicator is considered beneficial in technical analysis.
By understanding how to interpret RSI and integrate it into a broader trading strategy, traders can use this indicator to identify potential trading opportunities and make more informed decisions in the financial markets. Using the RSI indicator involves several steps such as:
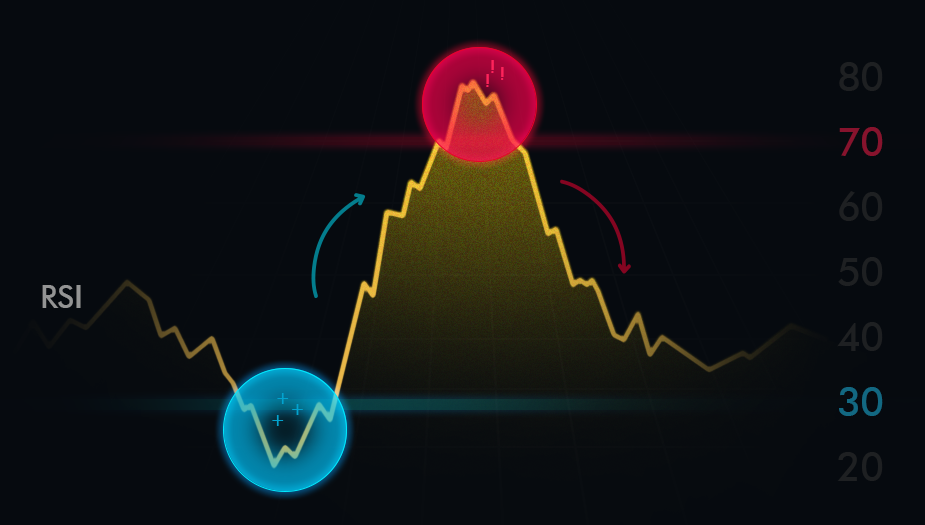
Questions about the RSI value plague many investors who trade in financial markets. The generally accepted RSI value lies within the range of 30 to 70.
When the Relative Strength Index (RSI) rises above 70, it typically signals that the asset is in the overbought zone. This condition suggests that the price has risen too quickly and may be due for a correction.
Traders often interpret this as a potential sell signal, expecting a downward movement as the market may soon reverse or consolidate to correct the excessive buying pressure.
If the RSI drops below 30, it indicates that the asset has entered the oversold zone. This suggests that the price has fallen sharply and may be undervalued, signaling a potential buying opportunity.
Traders view this as a possible buy signal, expecting an upward movement as the market could rebound from the excessive selling pressure. This zone can indicate a market bottom, where prices might soon start to rise.
A specific period is used as the basis when calculating the RSI. According to J. Welles Wilder Jr., who created the RSI indicator, this period is typically set at 14 days, a standard also used by many analysts. While it's possible to calculate the RSI over a longer period, it's important to remember that the longer the period, the less sensitive indicators become to price changes.
The RSI value, based on a shorter term, is more sensitive to price movements, so it produces a more accurate technical analysis signal.
Explaining the RSI formula in two steps will allow us to better explain the issue. Let's first calculate RS (relative strength) and then create this RSI formula, which corresponds to a value between 0 and 100:
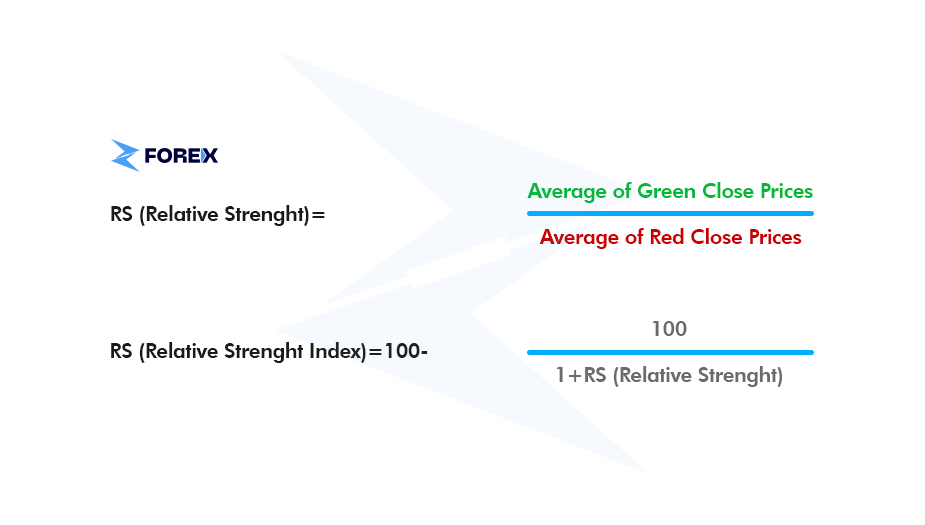
Calculating with the RSI formula will generate a value in the range of 0 to 100. This value, called RSI, measures the speed of price change. The upward momentum of the RSI indicates that the financial instrument continues to be heavily bought. A slowdown in the upward momentum of the RSI indicates that purchases for the asset have also declined.
While performing technical analysis with the RSI indicator, another extremely important factor is the so-called RSI divergence. So, what is an RSI mismatch and how should it be interpreted? Under normal conditions, the buy or sell direction signal, which shows us the trend line formed by the calculated RSI values, is expected to be parallel to the price chart of the product. However, in some cases, the price movement of the financial instrument moves in different directions with the signal given by the RSI value. This is called an RSI divergence.
When the price of a financial instrument declines in an opposite direction while the RSI indicator increases, this is called a bullish divergence of the RSI. If the RSI rises while the price continues to fall, this is interpreted as a strong medium- and long-term outlook for the financial asset in question.
Negative divergence (bearish divergence) is when prices move in the opposite direction and move upwards, when the RSI is declining. With RSI, a negative divergence is interpreted as a negative outlook for the financial asset in question. Therefore, as the RSI declines, the demand for the instrument also declines. In this case, the price increase can be interpreted as the result of a temporary or manipulative factor. Bearish divergence might indicate that the asset price could enter a downward trend in the medium to long term.
Suppose we have a financial asset called XYZUSD. Suppose the price of the asset has fallen to the region of 95, 92, 88, 85, 83 in recent days. And suppose the RSI value moved upwards towards the 76, 77, 79, 80, 81 zones in this period. So, we have a falling asset price trend and a rising RSI trend. These price movements can be technically interpreted as follows.
The price may drop, but it may be the result of a short-term and manipulative factor. According to the RSI chart, the price of this financial instrument may rise again in the medium term.
One other thing you should know about the RSI divergence is that even though the price in the base period has risen to a level where it has not risen before, or fallen to a level where it has not fallen before, the RSI chart may not go higher/ drop lower than its previous position. If such a divergence exists, it can be interpreted as indicating that the direction of the asset will also change.
In other words, when the asset price rises, this is interpreted as a falling market (sell signal), and when the asset price falls, the market starts to rise (buy signal).
Let us give an example to make this more concrete. Let the price of our XYZUSD instrument be in an upward movement along the price trajectory of 75, 77, 78, 80, 81. Let's assume that the RSI value exceeded 80 and started to create an overbought signal. Despite this sell signal from the RSI, the price of the asset continues to rise.
Technically, this means that the RSI does not confirm the uptrend, signaling that the uptrend could soon be replaced by a downtrend.
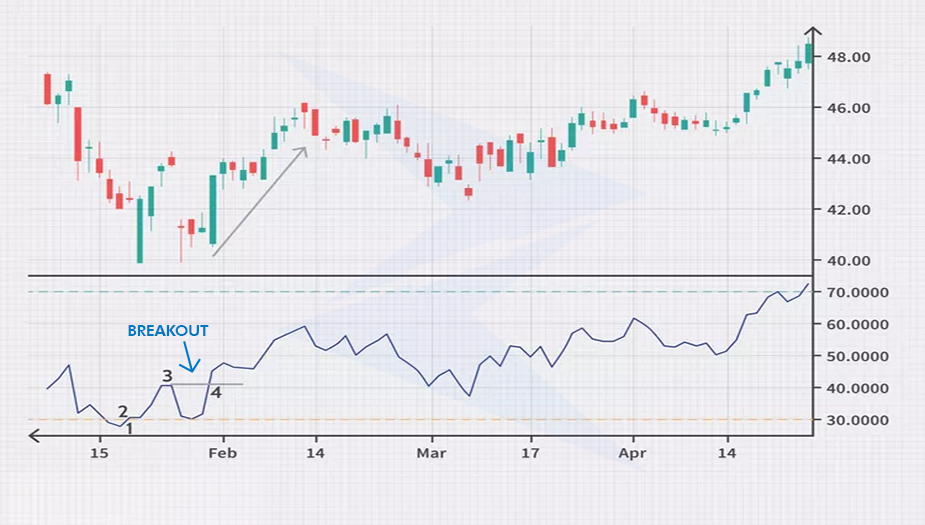
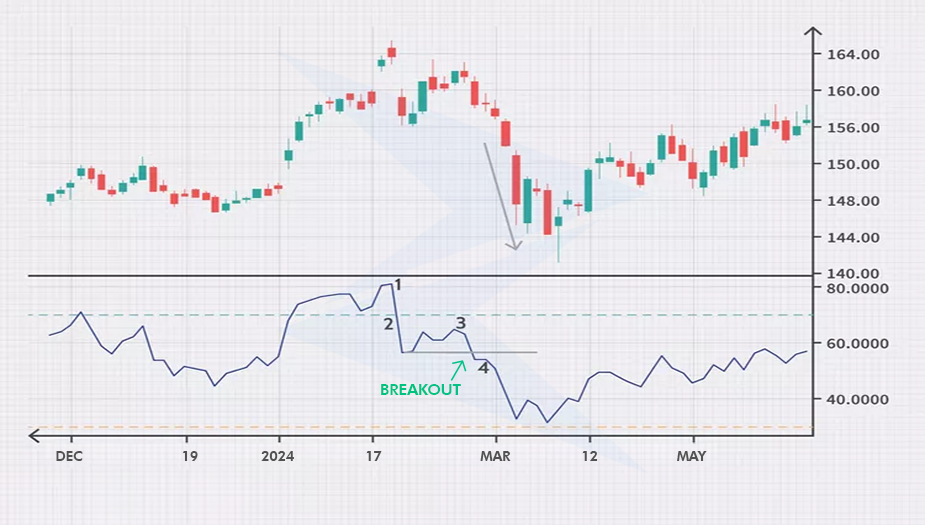
Price movements called RSI Swing Rejection or RSI Swing Error can generate extremely valuable analysis signals for traders. This technique examines the entry and exit movements of the RSI value into the overbought or oversold regions.
Swing rejection can occur in 2 different ways:
Finally, we can mention another analysis indicator calculated based on RSI values: Stoch RSI.
The concept of Stoch RSI was first mentioned in the book “New Technical Trader” written by Stanley Kroll and Tushar Chande and published in 1994.
The Stoch RSI is a technical analysis indicator that helps us understand whether an instrument is overbought or oversold, based directly on the RSI value, not the instrument's price. We would not be amiss if we called it an indicator of an indicator.
Stoch RSI = (Current RSI - Lowest RSI)/(Highest RSI - Lowest RSI)
Just like the RSI, the most common time frame for the Stoch RSI is 14 days. The Stoch RSI value for the last 14 hours can also be viewed using hourly charts.
As for the difference between Stoch RSI and Standard RSI; Stoch RSI, is a faster, more sensitive indicator, derived from the RSI. It gives traders more buy/sell signals than the RSI. This makes it a more useful tool for technical analysis. On the downside, among the many signals generated by Stoch RSI, a proliferation of false analyses may appear again. It is recommended to use the 3-day simple moving average along with the Stoch RSI to reduce the risk of these false signals.
What is RSI in stocks?
It is a popular tool used by stock traders. RSI helps traders identify overbought and oversold conditions in a stock, which can indicate potential buying or selling opportunities.
What does the RSI tell you?
It tells you about the momentum and strength of price movements in a stock or asset.
What if RSI is 70, is it good or bad?
An RSI of 70 indicates overbought conditions, suggesting that the stock may be due for a price correction or reversal to the downside. It's neither inherently good nor bad; it depends on the overall market context and other factors.
What is a good RSI to buy?
There's not a universally "good" RSI level to buy. However, some traders look for levels below 30 to indicate oversold conditions as potential buying opportunities, while others prefer to wait for confirmation signals.
Is RSI divergence profitable?
It can be profitable if combined with other analysis techniques and confirmation signals. It's not a standalone strategy.
What is the RSI chart?
It is a graphical representation of the RSI indicator plotted over a specific period.
Sign up in seconds for free, access your platform, and start trading with ease.
 $200 Oil Scenario: The Chain Reaction Across Markets
What happens if oil hits $200? See the impact on global markets, sectors, inflation, and which industries could win or lose.
Detail Biggest Manipulations in Financial Market History
Financial markets have seen their share of manipulation over the years. Here are seven of the biggest cases in modern history.
Detail Petrodollar System: Why It Still Matters
Energy markets depend on supply routes, currency systems, and trade infrastructure determine prices, inflation, and financial stability across the global economy.
DetailThen Join Our Telegram Channel and Subscribe Our Trading Signals Newsletter for Free!
Join Us On Telegram!


