


Trend following is a common trading strategy based on the idea that financial markets often move in long, sustained trends. Instead of predicting market tops or bottoms, trend followers aim to capture the "middle" part of a trend, when price movement is already underway and supported by momentum.
At its core, trend following operates under the principle: “The trend is your friend.” This means that traders look for established trends in price, whether upward or downward, and enter trades in the direction of that trend, expecting it to continue.
What sets trend following apart from other strategies is its simplicity and objectivity. Rather than relying on forecasts, it reacts to what the market is currently doing. Traders do not try to guess where the market will go, they follow where it is already headed.
Trend following works by identifying a market trend, either upward (bullish) or downward (bearish), and placing trades in the direction of that trend. The main idea is not to predict when a trend will begin or end, but rather to join it once it's clearly established.
Unlike reversal or contrarian strategies, trend followers do not try to catch the tops or bottoms. Instead, they aim to profit from the bulk of the trend, accepting that they may enter slightly late and exit after the trend has already started to reverse.
Key Principle: “Buy high, sell higher” / “Sell low, buy lower”
This mindset may seem counterintuitive, especially to new traders who are taught to “buy low and sell high.” In trend following, entering a position once momentum is already confirmed increases the likelihood of riding a strong and sustained move.
Trend following strategies take advantage of crowd behavior. When many traders and institutions move in the same direction, they create strong momentum. By aligning with that momentum rather than fighting it, trend followers aim to stay on the profitable side of market sentiment.
Before you can follow a trend, you need to identify whether one exists. Spotting a genuine trend is the foundation of any trend following strategy. Without a clear directional bias, entering the market can lead to false signals and unpredictable outcomes.
Markets can generally move in three directions:
There are several tools and methods traders use to confirm a trend:
Not every price movement is a trend. Markets are full of short-term fluctuations, often called “noise”, that can mislead traders. A key skill in trend following is filtering out this noise and focusing only on sustained movements supported by structure, momentum, and sometimes, volume.
Trend following has been used for decades, and its effectiveness has been demonstrated through many notable examples over the years. Here are some of the most well-known ones:
Long-term uptrend From $270/oz in 2001 to over $1,900/oz in 2011
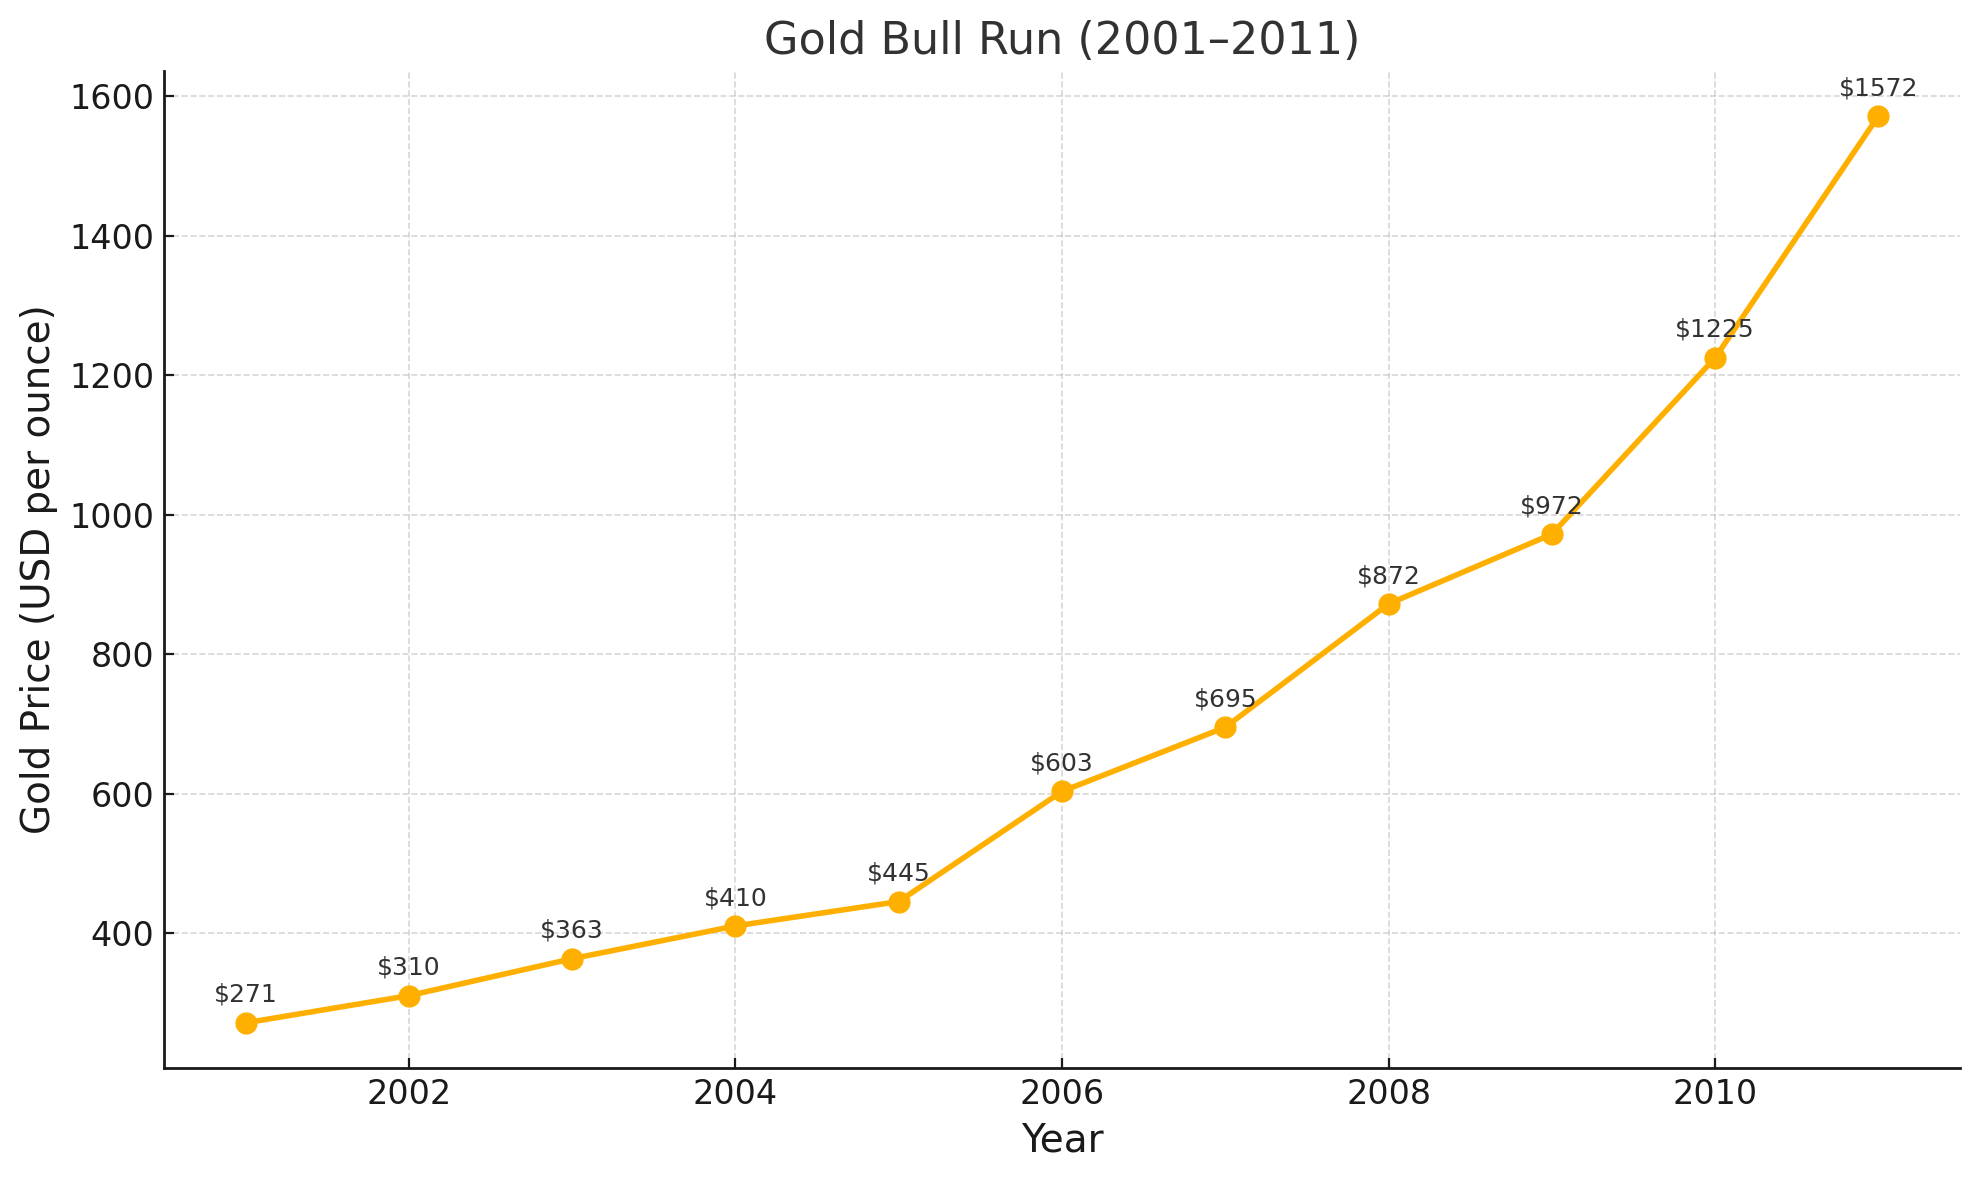
This was a textbook example of a sustained, long-term trend driven by macroeconomic fear and currency devaluation. Many strategies using moving averages or breakout systems captured large portions of this move.
Explosive uptrend From $10,000 in Sep 2020 to ~$69,000 in Nov 2021
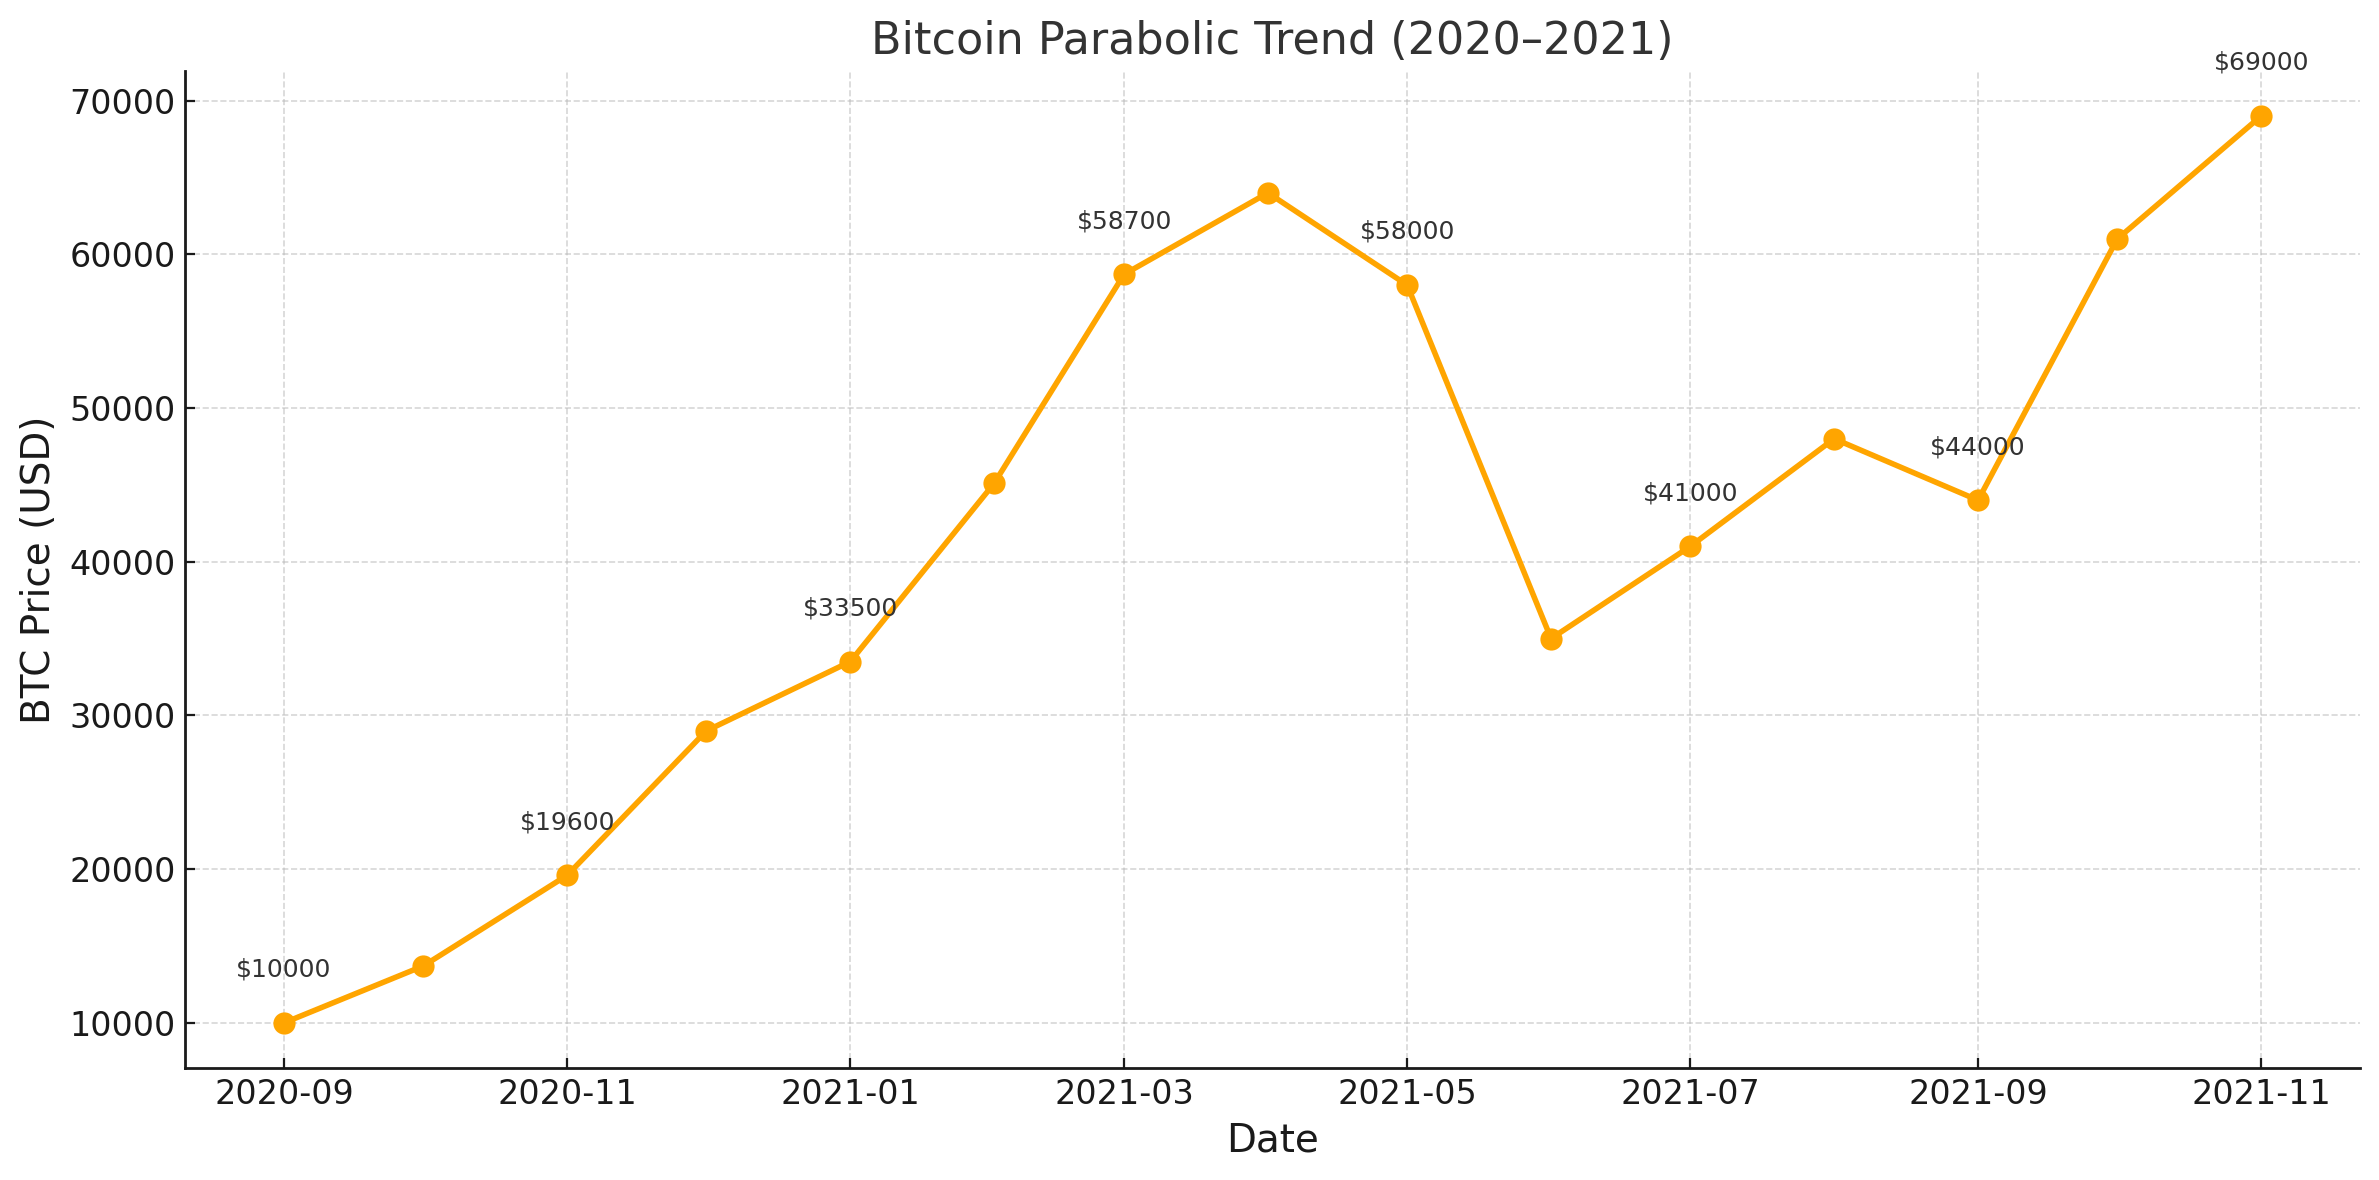
This was one of the most dramatic crypto bull runs, ideal for trend followers using momentum and breakout strategies. It also showed how social and speculative momentum can drive price far beyond traditional valuation metrics.
Explosive stock uptrend From $140 in October 2022 to over $900 by March 2024
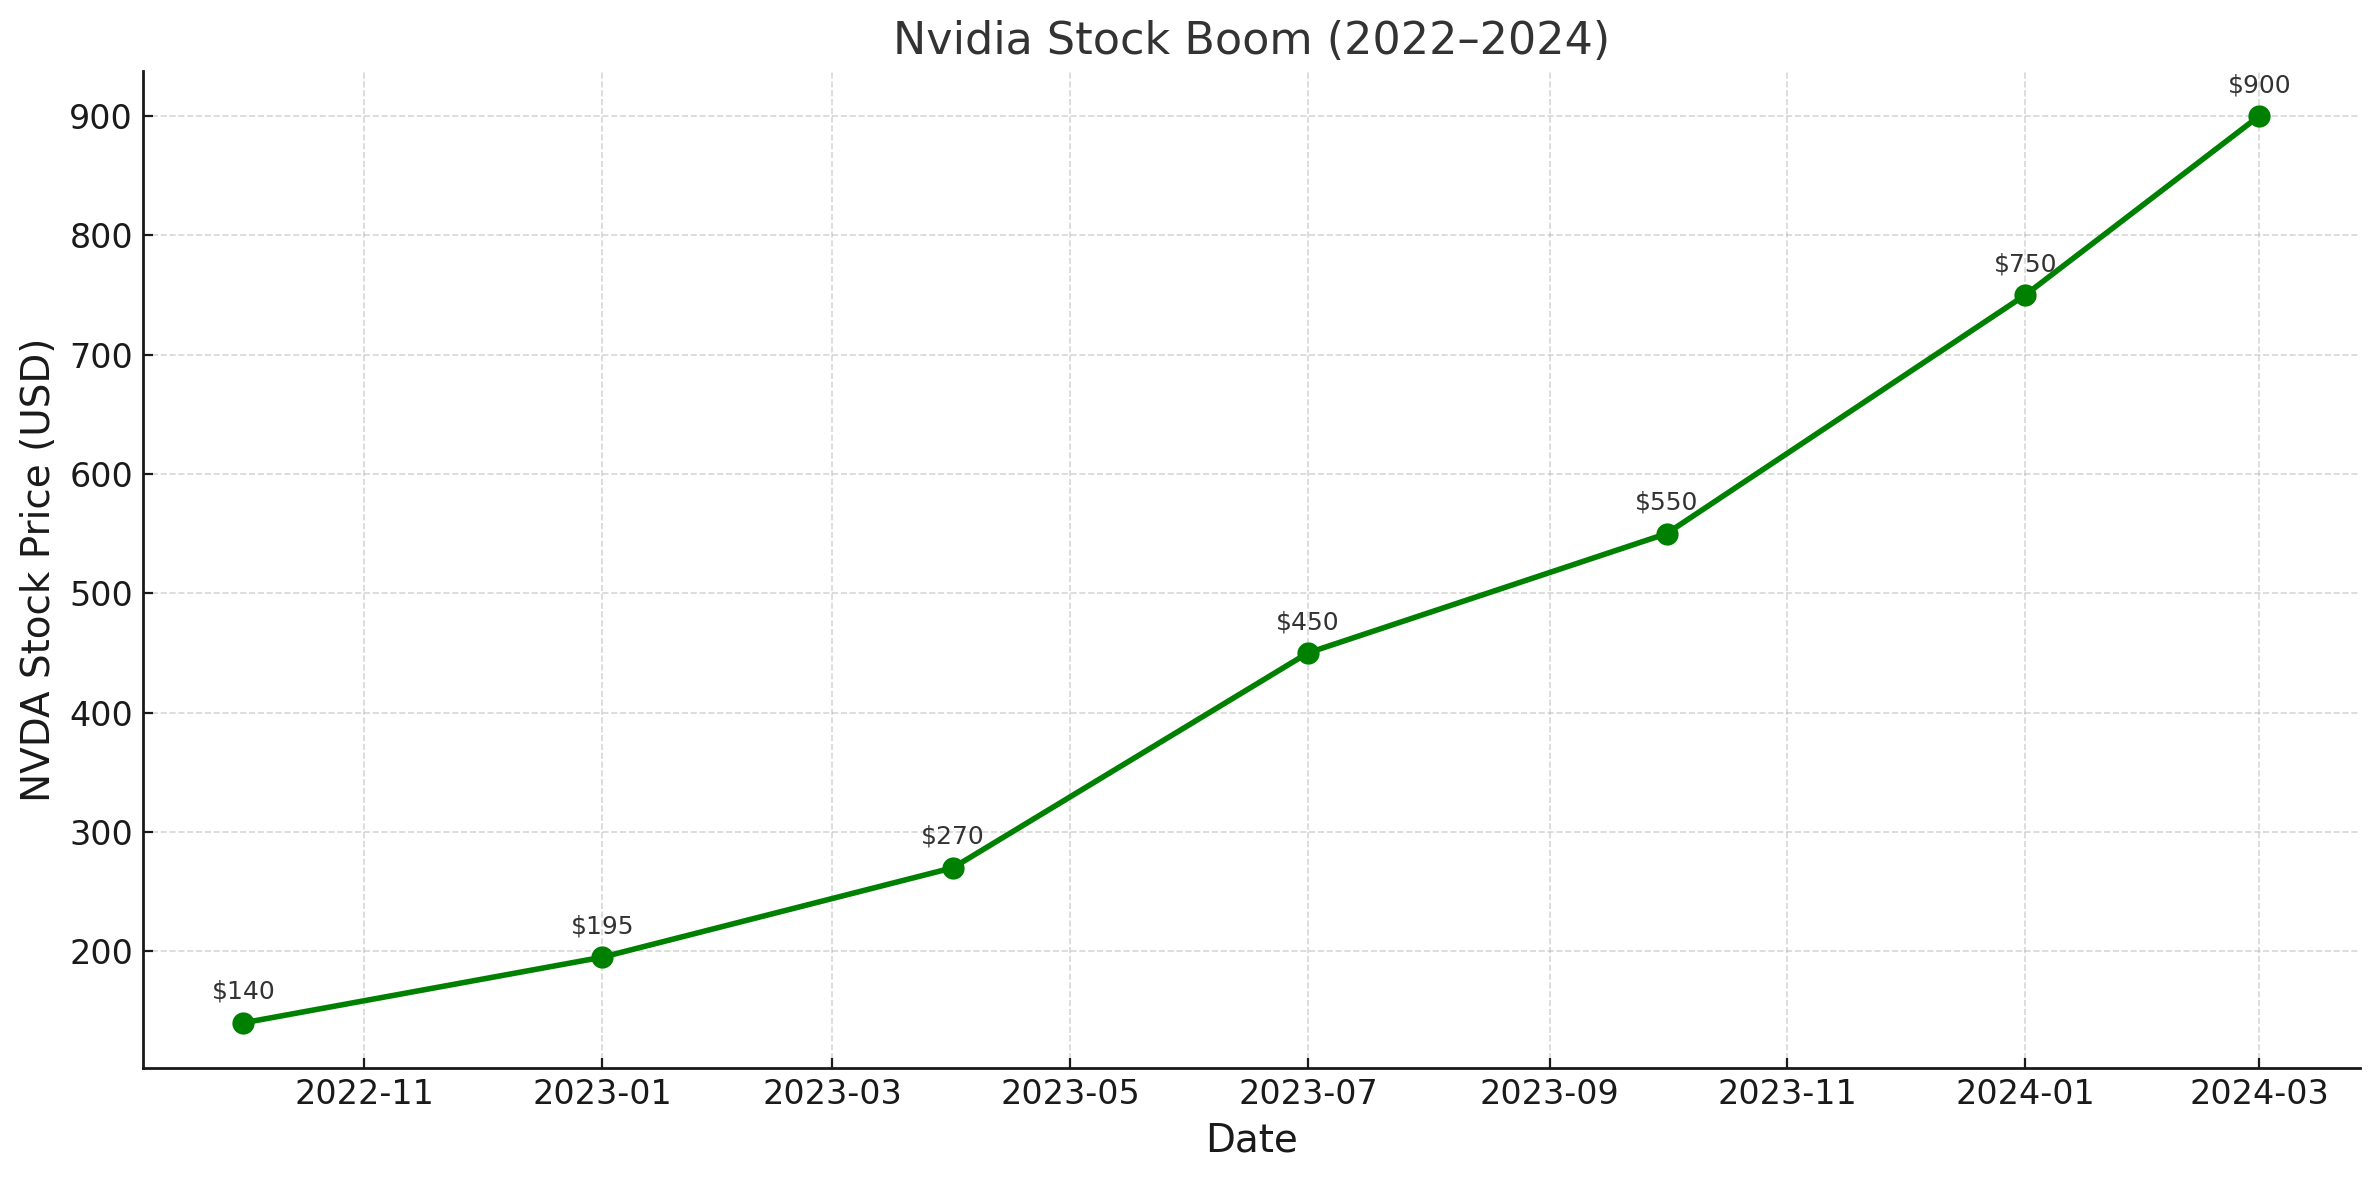
Nvidia’s run has been one of the clearest AI-driven stock trends, with clean momentum, strong fundamentals, and recurring institutional buying. Many swing and position traders captured this with trend-following strategies on the daily and weekly charts.
Trend following relies heavily on technical indicators to help traders identify, confirm, and ride trends. These indicators provide objective data that guide entry and exit decisions, reduce emotional bias, and increase consistency in trading.
Here are some of the most widely used indicators in trend-following systems:
Moving averages smooth out price data to help traders see the overall direction of the market.
Common use:
MACD is a momentum indicator based on the difference between two EMAs (typically the 12 and 26-period EMAs). It includes a signal line and a histogram to visualize strength and direction.
In trend following:
The ADX measures the strength of a trend, regardless of its direction. It ranges from 0 to 100:
Tip: Combine ADX with other indicators to confirm when a market is trending and when it’s best to stay out.
Parabolic SAR plots dots above or below the price to indicate trend direction and potential reversal points.
Use case:
Ideal for placing dynamic stop-loss levels and trailing stops.
A comprehensive indicator that provides insights on trend direction, support/resistance, and momentum, all in one view.
While it looks complex, many trend-following traders rely on it for its depth and clarity once mastered.
Each of these indicators has its strengths, and many traders use a combination for confirmation. The key is to choose tools that match your trading style, time frame, and risk tolerance, then stick to them with discipline.
A successful trend following strategy isn't just about spotting the trend—it's about knowing when to enter and how to exit. Good entries position you at the start or middle of a move; smart exits protect your capital and lock in profits when the trend shifts.
Let’s break down both parts:
The goal of a trend-following entry is to jump in once a trend is confirmed, but before it loses momentum.
Common entry methods include:
Trend followers don’t try to predict tops or bottoms, they let the market decide when the trend is over. This is where exit rules are important.
Common exit techniques:
Successful entries and exits are always aligned with risk management:
In trend following, it’s not about being right all the time, it’s about catching big movements that cover the losses from small, controlled setbacks. The power lies in the process, not prediction.
Not every trade is guaranteed to be profitable, but protecting your capital is essential to stay in the game long enough to catch the big trends.
One of the first rules is proper position sizing. Most trend followers risk only 1–2% of their account per trade. This approach helps absorb a string of small losses without impacting the trading balance irreversibly.
Stop-loss orders are non-negotiable. Whether fixed, volatility-based, or technical, stop-losses cap your downside and help you exit quickly when a trend fails to develop.
To lock in profits, many traders use trailing stops. These move with the price and protect gains while allowing the trade to continue if the trend stays strong.
Drawdowns are part of the process. A series of small losses during choppy or sideways markets is normal. Staying disciplined and avoiding emotional decisions during these periods is important.
| Market | Why It Works Well | Ideal Timeframes |
| Forex | Highly liquid, responds well to technical analysis, consistent trends in major pairs | Daily, 4H, 1H |
| Commodities | Strong macro-driven moves (e.g., oil, gold), often form clear long-term trends | Weekly, Daily |
| Indices | Reflect broader market sentiment, smooth price action over time | Weekly, Daily |
| Stocks | Growth stocks show sustained price movements, great for position trading | Daily, Weekly |
| Cryptocurrencies | High volatility and breakout behavior, ideal for aggressive trend-followers | 4H, 1H (Daily for swing) |
Like any trading strategy, trend following comes with both strengths and weaknesses. Understanding both sides helps traders apply the strategy more realistically and refine it according to their risk tolerance and market conditions.
Key Takeaways
Trend following is about aligning with the market. While the strategy comes with challenges like losses and false signals, its strength lies in simplicity, patience, and consistency. For those willing to trust the process, trend following offers a timeless approach to trading in any market.
Sign up in seconds for free, access your platform, and start trading with ease.
 $200 Oil Scenario: The Chain Reaction Across Markets
What happens if oil hits $200? See the impact on global markets, sectors, inflation, and which industries could win or lose.
Detail Biggest Manipulations in Financial Market History
Financial markets have seen their share of manipulation over the years. Here are seven of the biggest cases in modern history.
Detail Petrodollar System: Why It Still Matters
Energy markets depend on supply routes, currency systems, and trade infrastructure determine prices, inflation, and financial stability across the global economy.
DetailThen Join Our Telegram Channel and Subscribe Our Trading Signals Newsletter for Free!
Join Us On Telegram!


