


A price move can look strong enough to follow and stretched enough to reverse, all on the same chart. The Keltner Channel indicator helps you make sense of that tension by showing price in relation to its recent trend and volatility.
This guide explains how to read its three lines, set it up in MT5, and turn what you see into a trade plan.
The Keltner Channel is a technical indicator that places three lines over a price chart to help traders assess trend direction and volatility. Its outer bands adjust as recent price ranges change, giving you a reference for judging how far price has moved from its average.
The modern version has three components:
Each part serves a different purpose. The middle line helps you assess direction, while the distance between the outer bands reflects measured volatility. Wider bands indicate larger recent price ranges; narrower bands indicate smaller ones.
The original version, introduced by Chester Keltner in 1960, used a different calculation. This guide focuses on the modern EMA-and-ATR version, which is widely used today.
The calculation starts with the EMA. The indicator then adds and subtracts a multiple of ATR to draw the outer bands. ATR measures the size of recent price movements, accounting for gaps as well as each candle’s high-to-low range.
The formula is:
For example, suppose the EMA on the EUR/USD chart is 1.1000, ATR is 0.0010, or 10 pips, and the multiplier is 2.
Each outer band sits 20 pips from the middle line:
| Channel line | Calculation | Value |
| Upper band | 1.1000 + 0.0020 | 1.1020 |
| Middle line | EMA value | 1.1000 |
| Lower band | 1.1000 − 0.0020 | 1.0980 |
As new candles form, the EMA and ATR update, changing the channel’s position and width.
For the examples in this guide, we’ll use the following configuration:
| Setting | Starting value | What it controls |
| EMA period | 20 | How quickly the middle line responds to price |
| ATR period | 10 | The lookback used to measure volatility |
| ATR multiplier | 2 | Each outer band’s distance from the middle line |
| Price source | Close | The price used to calculate the EMA |
A shorter EMA responds faster but follows more short-term fluctuations. A longer EMA smooths those fluctuations while reacting more slowly. Increasing the multiplier widens the channel; reducing it brings the bands closer to the middle line.
Start with one configuration and observe it across different market conditions before making changes.
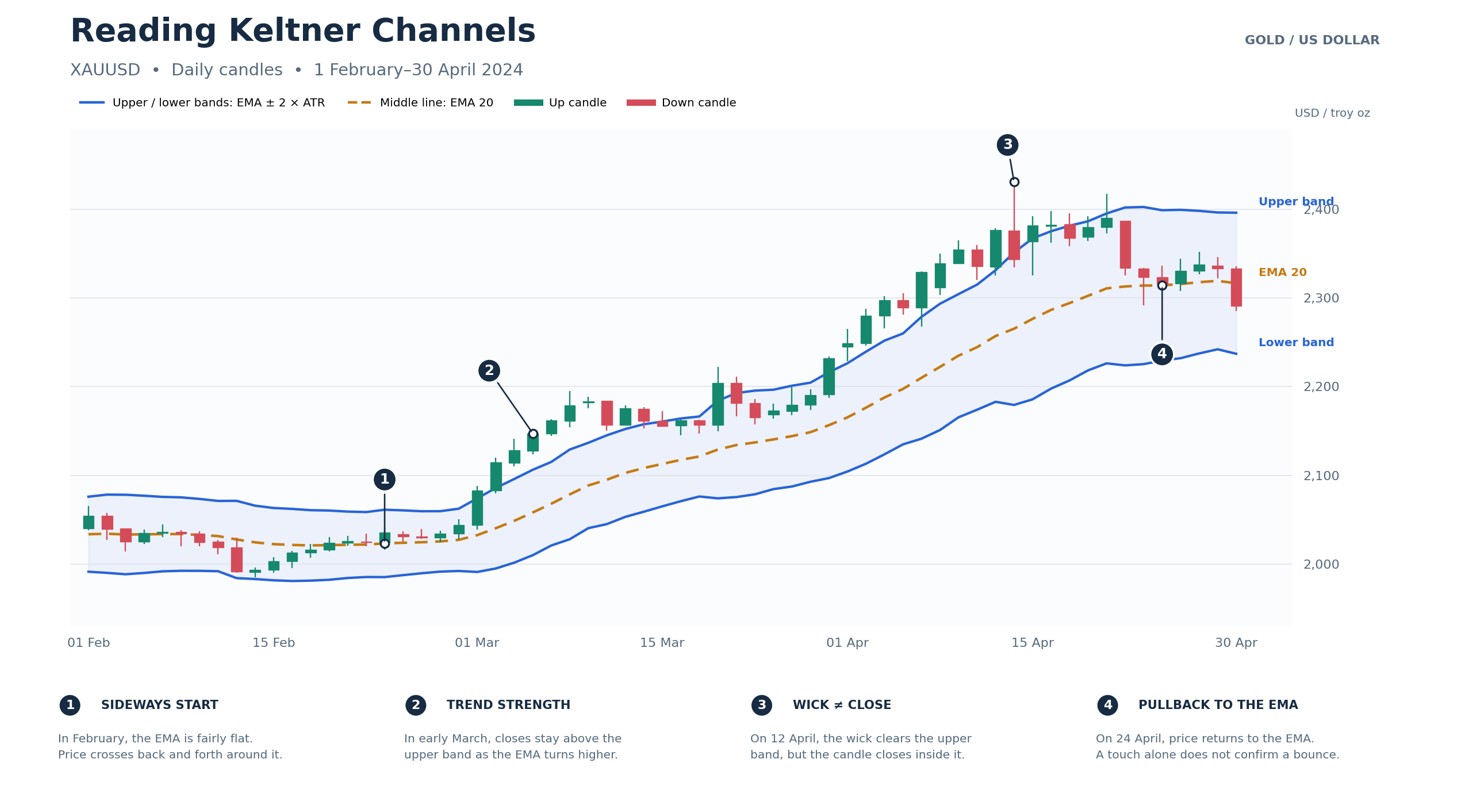
Start with the channel’s direction, then check where price sits within it and how wide the bands are. Reading these features together helps you distinguish a strong trend from a sideways market or a pullback. The XAUUSD daily chart below shows how those conditions can change over time.
The slope of the EMA gives you an initial view of the trend:
At point 1, gold’s EMA is relatively flat, with price trading on both sides during February. By March, the line turns upward and price spends more time above it.
Check the candles alongside that slope. Higher swing highs and higher swing lows support an upward-trend reading. A flat EMA alone is not enough to establish a reliable trading range.
During a strong advance, price can repeatedly reach or close above the upper band. During a strong decline, it can do the same below the lower band. An outer-band touch is not an automatic reversal signal.
At point 2, several March candles close above the upper band while the EMA rises. Those closes show that gold is advancing strongly relative to its recent volatility. Selling simply because price looks “too high” would mean trading against that strength.
Also distinguish between a wick and a completed candle. At point 3, on 12 April, gold trades above the upper band but closes back inside it. The wick shows how far buyers pushed the price; the close shows that they did not hold those higher levels through the end of the candle. That deserves attention, but it does not confirm a downtrend by itself.
The middle line provides another useful reference. At point 4, on 24 April, price returns toward the EMA after the advance. This is a pullback to assess, rather than an automatic buying opportunity. Watch whether price holds the area and resumes rising or begins forming lower highs and lower lows. On this chart, gold later closes below the EMA on 30 April.
The channel is narrower during February and widens as gold’s price ranges increase into April. This tells you that recent price movement has become larger.
Width does not tell you the direction of the next move. Both a sharp rally and a sharp sell-off can increase ATR and widen the bands. Similarly, narrowing bands indicate quieter recent trading without telling you whether the next breakout will be upward or downward.
Before interpreting any signal, put the three observations together: which way the EMA slopes, where candles close, and whether volatility is expanding or contracting.
You’ll need a custom indicator to display Keltner Channels in MT5. Here’s how to install a free version on the desktop platform:
To change the settings later, press Ctrl+I, select the indicator, and click Properties. Save the finished setup through right-click chart → Templates → Save Template.
Note: This installation works on MT5 desktop. The Android and iOS apps do not support custom indicators.
Choose the setup that matches the market: a pullback within a trend, a breakout from consolidation, or a rejection within a range. The following rules provide a starting point for demo testing.
Trend Pullback Setup
In an uptrend, look for a rising EMA and higher swing highs and lows. Wait for price to pull back toward the middle line, then watch for a bullish candle that closes back above it.
One entry rule is to buy at the next candle’s opening, with a stop below the pullback low. Use the previous swing high as a potential target. Skip the trade if that target leaves too little reward compared with the stop distance. Reverse these conditions for a short setup.
Breakout Setup
Mark the upper and lower boundaries of a consolidation. For a bullish setup, wait for a candle to close above both the upper channel band and the consolidation high.
One approach is to enter at the next candle’s opening, place the stop below the breakout candle’s low, and target twice the initial risk. Skip the entry if nearby resistance blocks that target or price has already moved substantially beyond the signal close. Reverse the rules for a bearish breakout.
Range Rejection Setup
Look for a flat EMA and repeated reactions at horizontal support and resistance. For a long setup, wait for price to test support near the lower band, then form a bullish candle closing back inside the channel.
Enter at the next candle’s opening, place the stop below the rejection low, and use the EMA’s value at entry as a fixed initial target. Skip the trade if the distance to that target is smaller than the stop distance. For a short setup, look for rejection at resistance near the upper band.
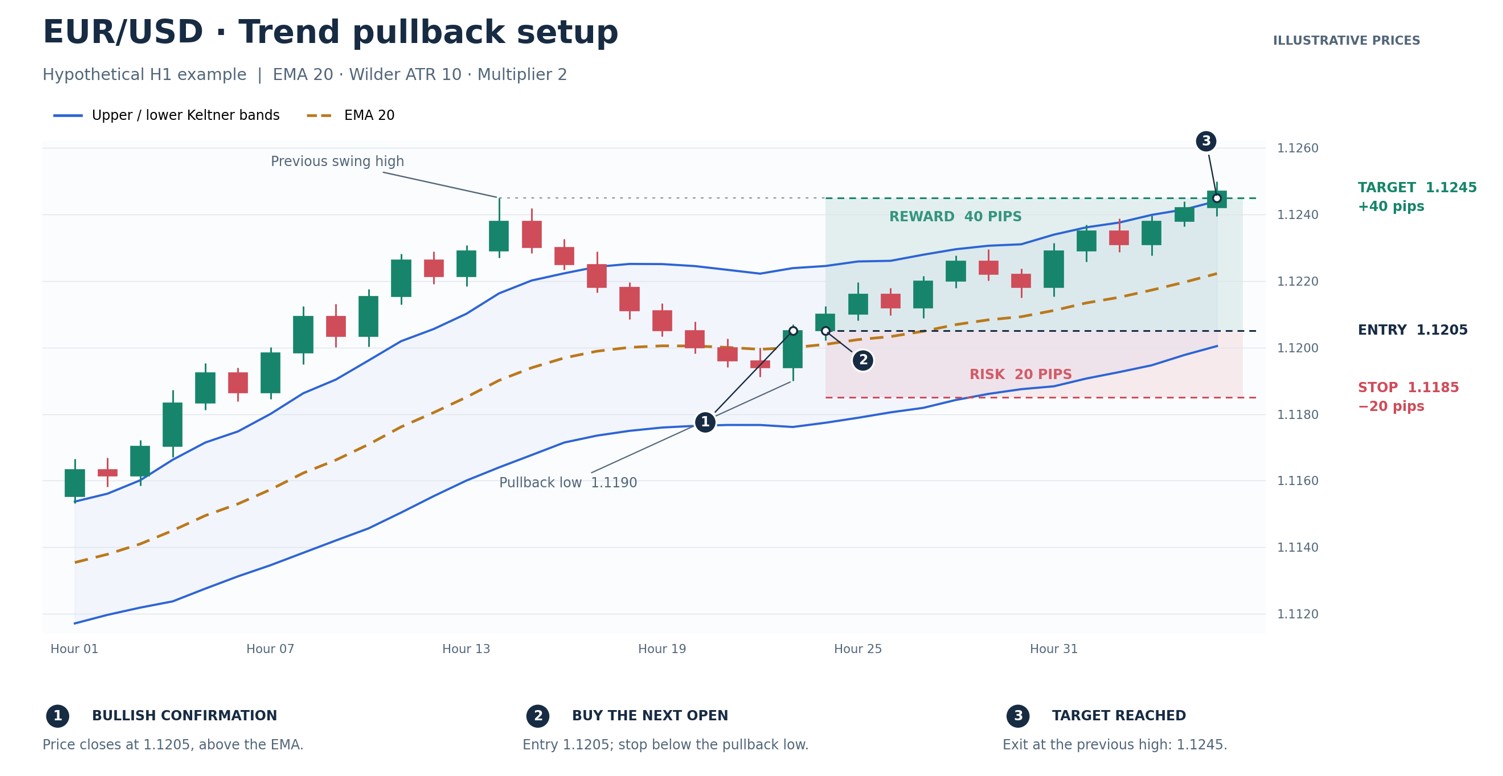
Suppose the EUR/USD pair is trading around 1.1200 on an H1 chart. The EMA slopes upward, and price has formed higher highs and higher lows. We’re using EMA 20, ATR 10, and a 2× multiplier.
Price pulls back toward the EMA at approximately 1.1200, briefly reaches 1.1190, and then forms a bullish candle closing at 1.1205. The next candle opens at the same price, providing our example entry.
These are hypothetical prices for an educational example, not a historical trade or a live quote.
| Trade component | Example |
| Buy entry | 1.1205 |
| Pullback low | 1.1190 |
| Stop-loss | 1.1185, five pips below the pullback low |
| Take-profit | 1.1245, the assumed previous swing high |
| Initial risk | 20 pips |
| Potential reward | 40 pips |
| Planned reward-to-risk | 2:1 before costs |
The stop gives the trade room below the pullback low, while the target corresponds to a previously identified price level. Both are fixed before entry.
If price reaches 1.1245 first, the planned gain is 40 pips. If it falls to 1.1185 first, the planned loss is 20 pips. Actual results depend on execution and trading costs. A later touch of the upper channel band does not change this example’s exit plan.
Both indicators place bands around a moving average, but their different volatility calculations affect how those bands respond to price.
| Feature | Keltner Channel | Bollinger Bands |
| Middle line | Usually a 20-period EMA | Usually a 20-period SMA |
| Band calculation | Moving average ± a multiple of ATR | Moving average ± a multiple of standard deviation |
| What determines width | Recent trading ranges, including price gaps | How widely prices are dispersed around their average |
| Typical appearance | Generally smoother changes in channel width | Often expands and contracts more sharply |
| Example settings | EMA 20, ATR 10, multiplier 2 | SMA 20, standard deviation multiplier 2 |
| Practical use | Assessing trend direction, pullbacks, and moves beyond the recent trading range | Assessing relative price extremes, volatility compression, and expansion |
Neither indicator makes an outer-band touch an automatic buy or sell signal. Both can remain stretched during a strong trend, so interpret the bands alongside price structure.
Does the Keltner Channel repaint?
Standard versions update on the current candle but keep completed-candle values fixed unless price data changes. Wait for the candle to close when using close-based signals.
Why do the same settings look different across platforms?
Price feeds, candle closing times, and calculation methods can differ. Match the timeframe, price source, EMA period, ATR period, multiplier, and smoothing method.
Can Keltner Channels send alerts on MT5?
Yes, if your custom indicator supports them. Choose candle-close alerts when your strategy requires a confirmed close outside the band.
Does a 2× ATR channel contain 95% of price movements?
No. ATR multiples do not represent statistical probabilities. Price can stay outside the channel during a strong trend.
Can I recreate Keltner Channels with MT5’s Envelopes indicator?
Not exactly. Envelopes indicator uses a fixed percentage distance from a moving average; Keltner Channels adjust that distance using ATR.
در عرض چند ثانیه به صورت رایگان ثبتنام و به پلتفرم خود دسترسی پیدا کرده و به راحتی معامله کنید.

 مقایسه حسابهای PAMM و MAM با کپی تریدینگ؛ تفاوتها و نحوه عملکرد
در حسابهای PAMM، سرمایه چند سرمایهگذار در یک ساختار مشترک مدیریت میشود و سود و زیان متناسب با سهم هر فرد محاسبه میشود. در مقابل، سیستم MAM به مدیر سرمایه اجازه میدهد معاملات را از طریق یک حساب اصلی روی چند حساب مجزا اجرا کند. در کپی تریدینگ (Copy Trading) نیز معاملات یک معاملهگر بهصورت خودکار در حساب مستقل دنبالکننده تکرار میشوند.
جزئیات شاخص فوتسی ۱۰۰ (FTSE 100) چیست؟
شاخص فوتسی ۱۰۰ عملکرد بزرگترین شرکتهای پذیرفتهشده در بورس لندن را دنبال میکند. با نحوه محاسبه و عوامل مؤثر بر عملکرد آن آشنا شوید.
جزئیاتهمین حالا به کانال تلگرام زفارکس بپیوندید و سیگنالهای معاملاتی رایگان را دریافت کنید!
به کانال تلگرام ما بپیوندید!


