



Some markets move with a clear trend. Others seem to change direction every few candles. Price breaks a level, quickly reverses, and leaves traders reacting to one false signal after another. This is known as a choppy market and learning how to recognize it can help traders avoid poor entries, unnecessary losses, and overtrading.
A choppy market is a period when price moves up and down without forming a clear trend. Buyers and sellers take control for short periods, but neither side can maintain momentum.
Common signs include:
A sideways market usually moves between clear support and resistance levels. These boundaries may still offer structured trading setups.
A choppy market is less organized. Price may break levels, reverse quickly, and produce false signals across the range.
|
Sideways Market |
Choppy Market |
|---|---|
| Clear range boundaries | Unclear or frequently broken levels |
| More organized movement | Irregular price movement |
| Range edges may offer setups | Signals may fail across the range |
These conditions can appear during both low and high volatility.
Low-volatility chop produces small candles and narrow price movement. High-volatility chop creates sharp swings, long wicks, and frequent reversals.
Volatility shows how much price moves. It does not show if the market has a clear direction.
It generally appears when neither buyers nor sellers gain a decisive advantage. Several factors can create this environment.
Neither side has enough strength to control the market. Price moves higher, sellers respond, and the move quickly fades.
Trading activity often slows before key events like interest rate decisions, inflation data, earnings reports, or employment releases, with many traders waiting for greater clarity before committing to larger positions.
Some data may support higher prices while other reports point lower. This creates uncertainty and frequent changes in market direction.
Low trading activity can make price less stable. This may happen during holidays, quiet sessions, or in less traded instruments.
This type of price action can appear after a strong trend. It may signal a short pause, the start of a reversal, or a consolidation phase before the next major move.
No single technical signal can reliably identify a choppy market. Confirmation comes from several indicators aligning.
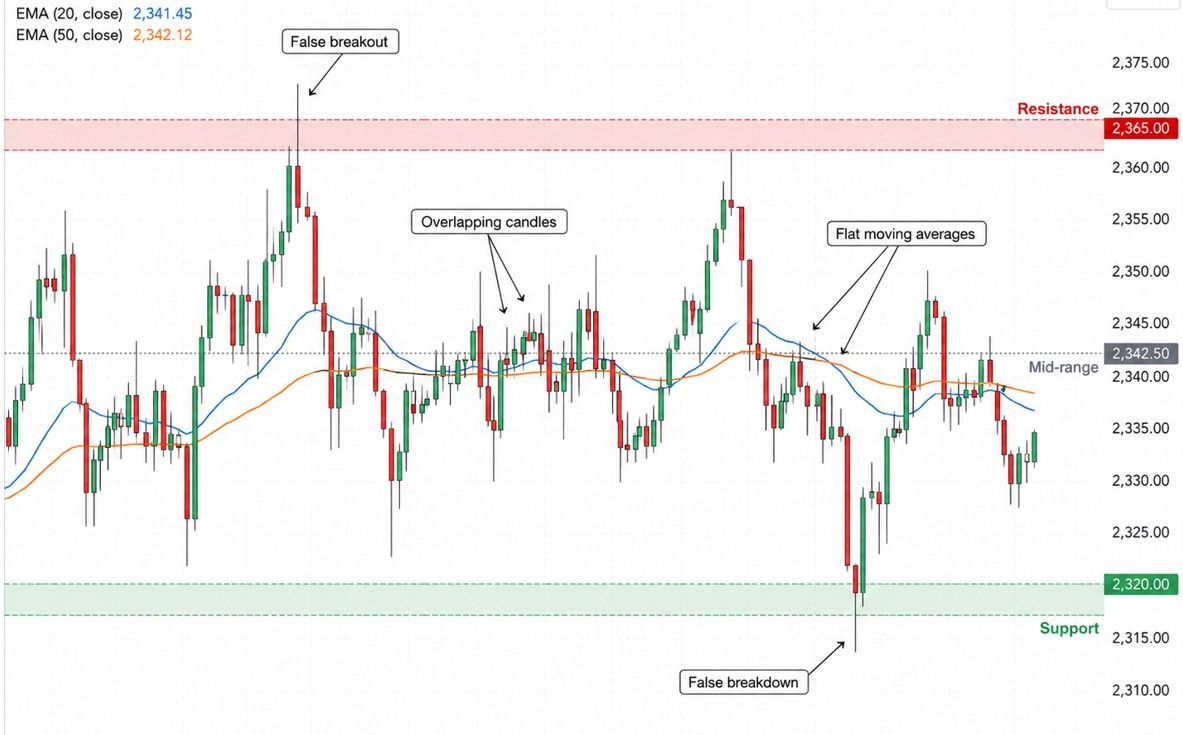
Start by checking the highs and lows. An uptrend forms higher highs and higher lows, while a downtrend forms lower highs and lower lows.
When price creates neither pattern and keeps returning to the same area, the market may be choppy.
The charts usually contain candles that cover the same price zones. Bullish and bearish candles may alternate without making much progress.
Long wicks and small candle bodies also show that buyers and sellers are struggling for control.
Clear ranges normally have visible upper and lower boundaries. In a choppy market, price may repeatedly move above and below these levels.
A breakout that quickly returns inside the range is another warning sign. False breaks can be especially sharp during volatile periods.
Moving averages may become flat and stay close together. Price can also cross above and below them several times.
These repeated crossovers may create conflicting signals because moving averages work better when a clear trend is present.
The Average Directional Index measures trend strength, not direction.
An ADX reading below 20 generally suggests that no strong trend is present. A falling ADX can also show that the current trend is losing strength.
Rather than being used on its own, ADX should reinforce what the price chart is already indicating.
The CHOP indicator helps traders compare trending and sideways conditions.
Higher readings suggest more sideways movement. Lower readings point to stronger directional price action. However, the indicator does not predict whether the next move will be bullish or bearish.
A market can look choppy on a 15-minute chart but remain bullish on the daily chart.
Check the higher timeframe for the wider trend. Then use the lower timeframe to study the current price structure and possible entry.
The strongest warning appears when several signs agree: unclear market structure, overlapping candles, failed breakouts, flat moving averages, and weak trend indicators.
A choppy market does not always lead to the same outcome. Price may continue the previous trend, reverse direction, or remain inside the range for longer.
Sometimes such price moves are only a pause. After consolidation, price breaks out and continues in the same direction as the earlier trend.
Choppy conditions can also appear when an existing trend is losing strength. A break of major support or resistance may then start a move in the opposite direction.
Not every breakout becomes a new trend. Price may briefly move outside the range and then return, creating another false signal.
Traders can look for several signs:
The breakout direction should be confirmed rather than predicted. These periods can last longer than expected.
Choppy conditions can expose weak trading habits quickly. Most losses come from forcing trades when the market has no clear structure.
Treating Every Move as a New Trend
A few strong candles do not always mean a trend has started. Price may reverse before any real structure develops.
Trading in the Middle of the Range
The middle offers poor risk-to-reward. Price can move toward either side without warning.
Chasing Every Breakout
False breakouts are common in choppy markets. Entering before the candle closes or the level holds can lead to quick losses.
Using Too Many Indicators
Several indicators may produce conflicting signals. More tools do not always mean better decisions.
Increasing Position Size After Losses
Trying to recover quickly can make a small drawdown much worse. Position size should stay controlled.
Moving the Stop-Loss
A stop should mark where the trade idea is no longer valid. Moving it only increases the risk.
Overtrading
Choppy markets can create many weak setups. Taking fewer trades can protect both capital and focus.
Choppy markets require patience, discipline, and tighter control over risk. The main goal is not to trade every move. It is to avoid weak setups and wait for better conditions.
Accept That Not Trading Is an Option
Some market conditions do not suit every strategy. When price has no clear structure and recent breakouts keep failing, staying out can be the best decision.
Waiting also protects traders from emotional entries. A missed trade costs less than several forced trades.
Reduce Trade Frequency
Choppy markets can produce many signals, but most of them have limited follow-through. Traders should wait for price to reach an important level instead of reacting to every candle.
Setting a daily trade limit can also help. This reduces overtrading after several failed setups.
Use Smaller Position Sizes
False signals and sudden reversals are more common in choppy conditions. Smaller positions reduce the impact of repeated stop-outs.
The stop-loss should still be placed at a logical invalidation point. Position size can then be adjusted to keep the total risk under control.
Focus on the Range Edges
Well-defined support and resistance levels often provide the best setups. Buying near support or selling near resistance allows for a more attractive risk-to-reward profile.
Entries near the middle of the range are weaker. Price can reverse in either direction, while the distance to the next level is usually limited.
Wait for Breakout Confirmation
Do not chase the first move outside the range. Choppy markets regularly produce brief breaks that quickly fail.
Look for a candle close outside the range, stronger momentum, or a successful retest. These signs do not guarantee continuation, but they provide better confirmation than the first price spike.
Keep Stops Based on Structure
A stop-loss should show where the trade idea is no longer valid. It should not be placed too close to the entry just to reduce the number of pips at risk.
Choppy price action can easily trigger tight stops. When the required stop is wider, traders can reduce position size or skip the setup.
Use Realistic Profit Targets
Choppy markets may not support large trend-based targets. Traders may aim for the range midpoint, the opposite boundary, or a nearby technical level.
Profit expectations should match the available price space. Holding for an oversized target can turn a winning trade into a loss.
Stop Trading After Repeated Failures
Several failed trades can be a sign that the market does not suit the strategy. Continuing to trade may lead to frustration and larger mistakes.
A disciplined stop rule, such as calling it a day after two or three losses, can protect your capital and the quality of your decisions.
Sign up in seconds for free, access your platform, and start trading with ease.

 How Index Futures Influence the Stock Market Open
How do index futures influence the stock market open? Learn what pre-market moves reveal about opening prices, market sentiment, and trader psychology.
Detail What Is the Nasdaq?
What is the Nasdaq? Learn how the Nasdaq Composite Index works, which stocks it includes, and what influences its performance.
Detail What Is the FTSE 100?
The FTSE 100 tracks the largest companies listed on the London Stock Exchange. Explore how it is calculated and what influences its performance.
DetailThen Join Our Telegram Channel and Subscribe Our Trading Signals Newsletter for Free!
Join Us On Telegram!


